Git Analytics Inside Your JetBrains IDE
Understand your codebase, track developer contributions, and detect anomalies — all without leaving your IDE. 100% local. Zero data leaves your machine.
Stop Guessing About Team Performance
Get data-driven insights into developer contributions. See who changed what, where, and when — with full code context. Prepare for performance reviews in minutes, not hours.
For team leads →See Your Real Contribution
Track your work across the codebase. Filter out auto-generated code and tests. Prepare for self-reviews with concrete data about your areas of impact.
For developers →Your Code Stays on Your Machine
Zero network requests. No external services. No data collection. Git Insight runs 100% locally — your security team will love it.
Learn about privacy →What Makes Git Insight Different
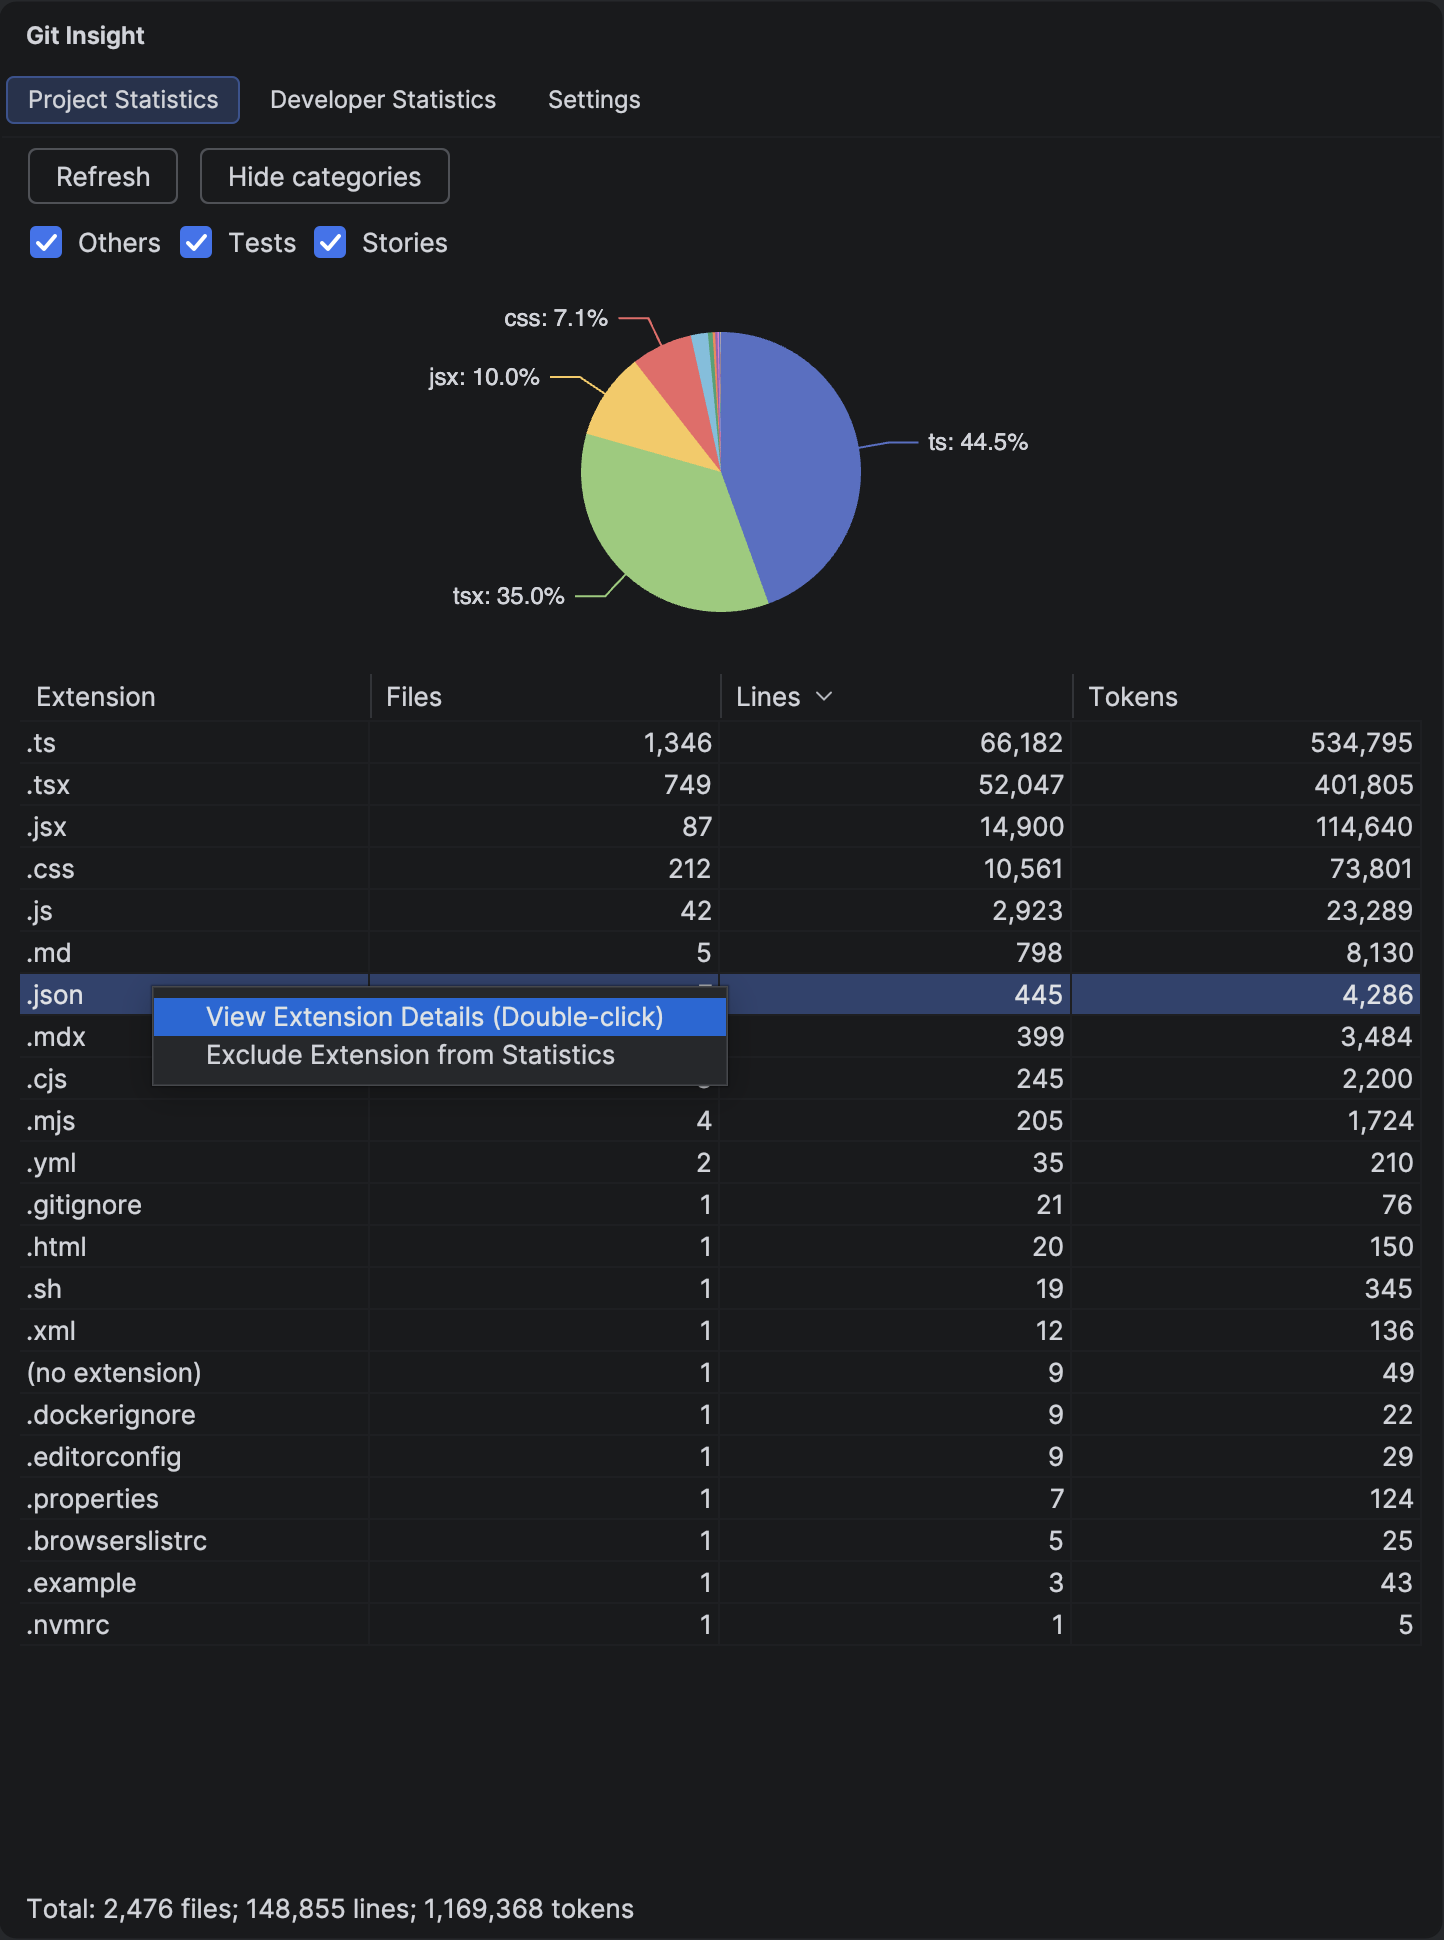
Project Statistics
Get a quick overview of your entire codebase — see how many files, lines, and tokens exist for each file extension.
Learn more →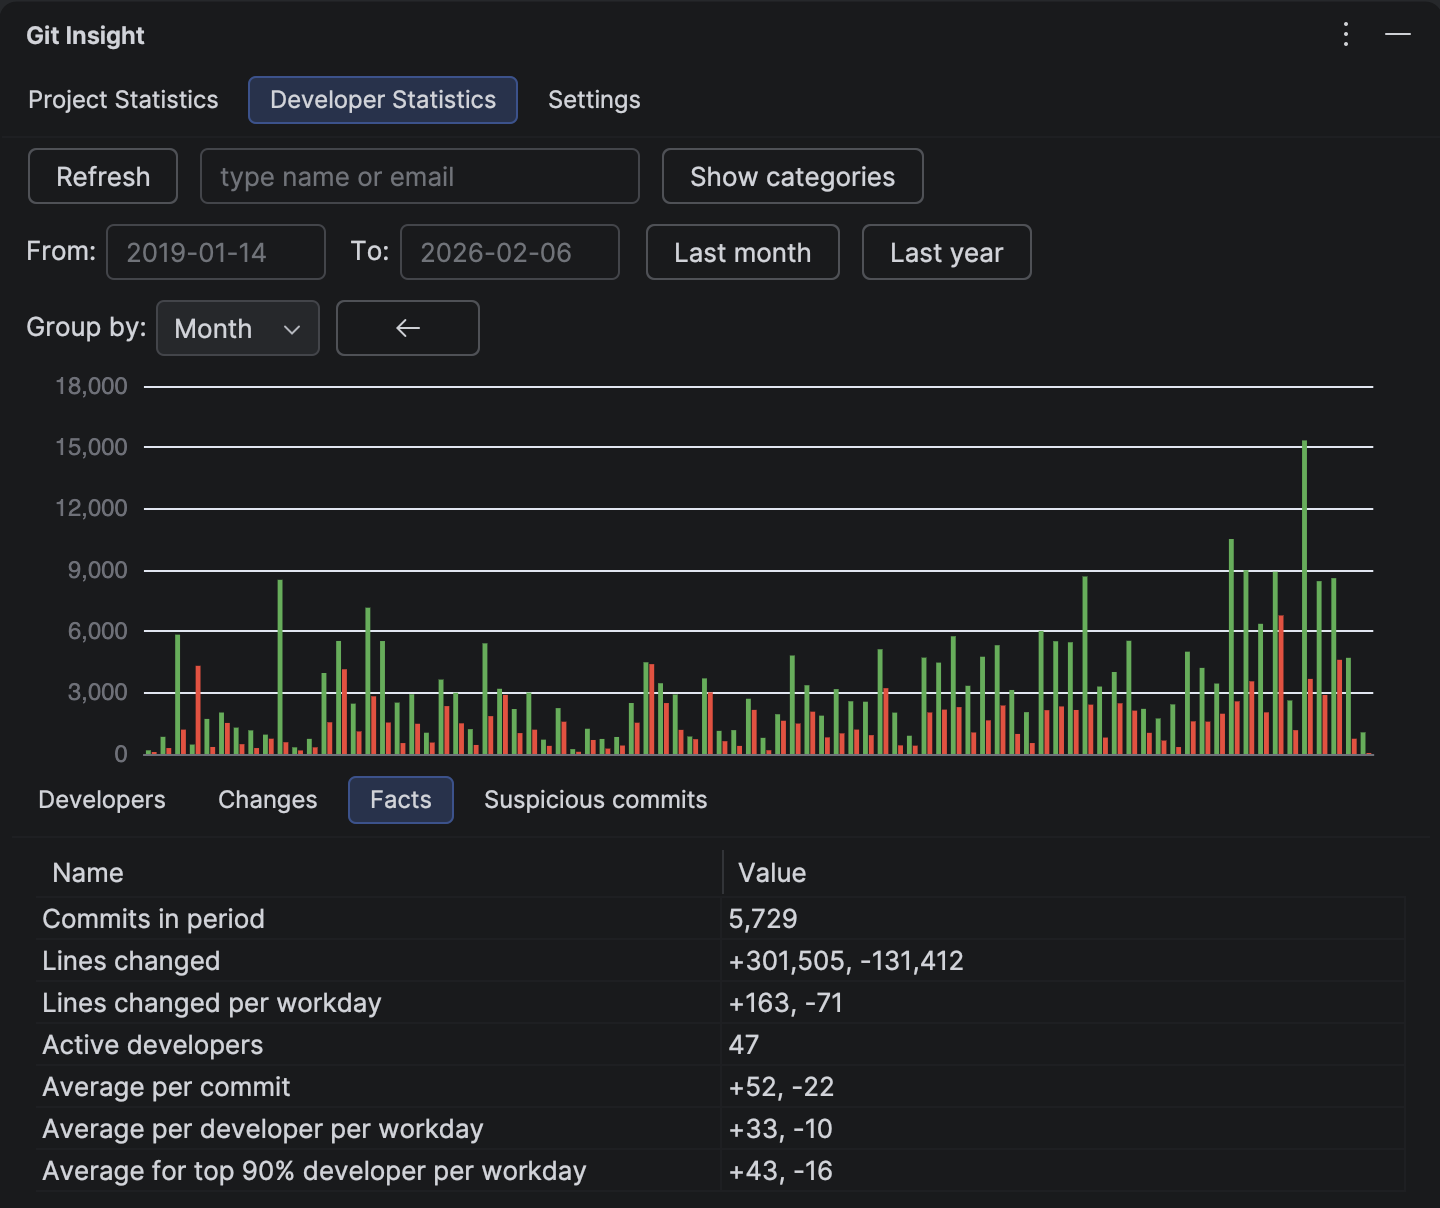
Project Facts
Get analytical metrics that go beyond raw numbers. Facts include velocity calculations, workday adjustments, and averages.
Learn more →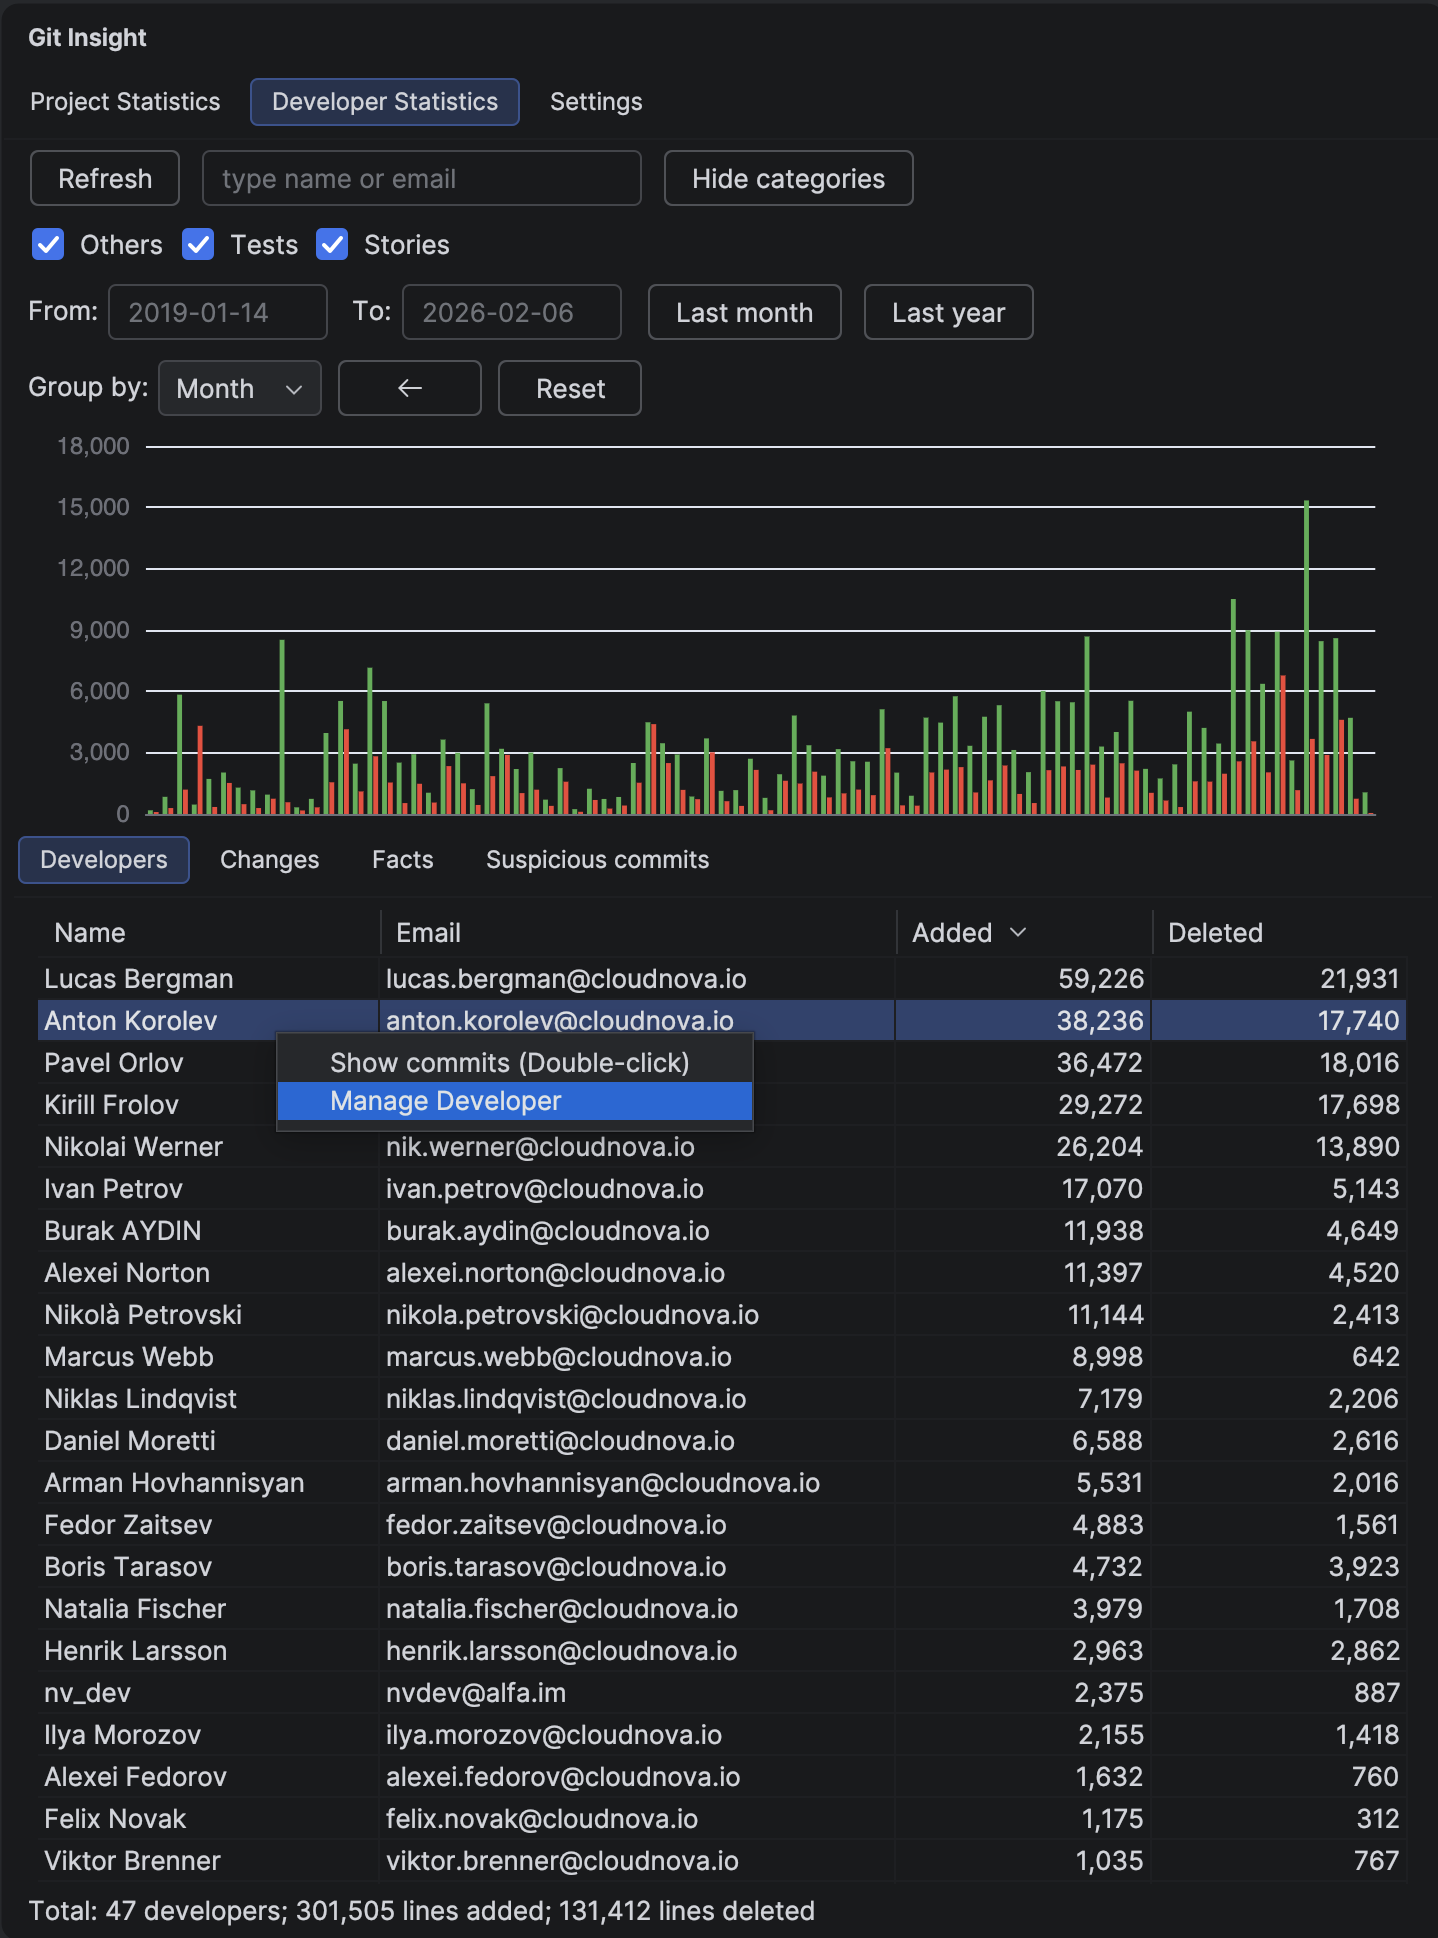
Developer Statistics
The central hub for understanding developer contributions. View aggregated statistics and filter by date ranges.
Learn more →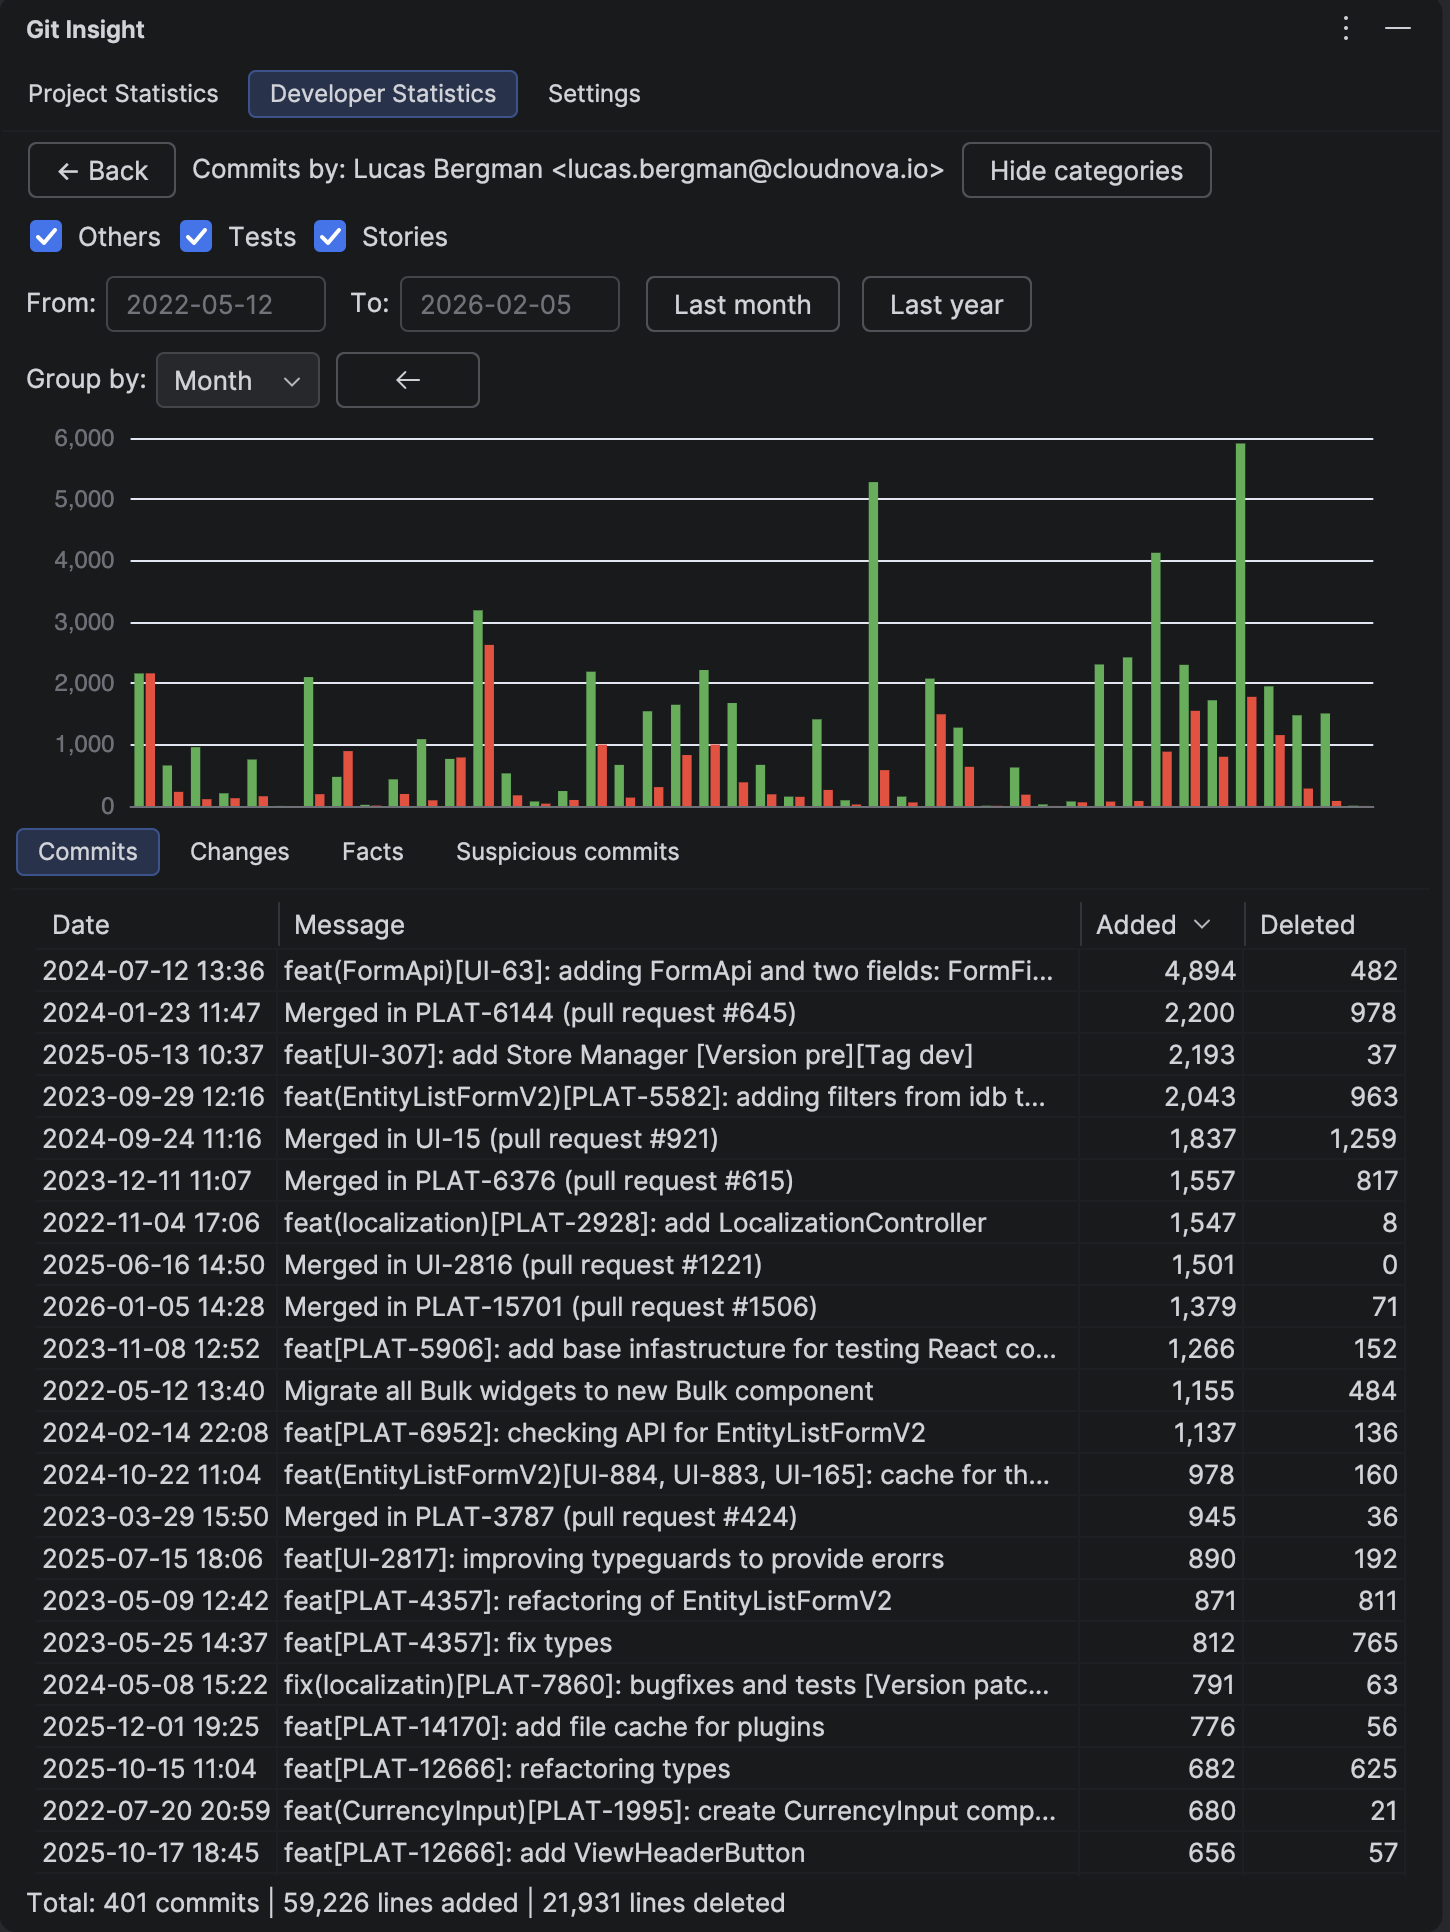
Developer Commits
See every commit made by a developer in a sortable table. Perfect for understanding individual contribution patterns.
Learn more →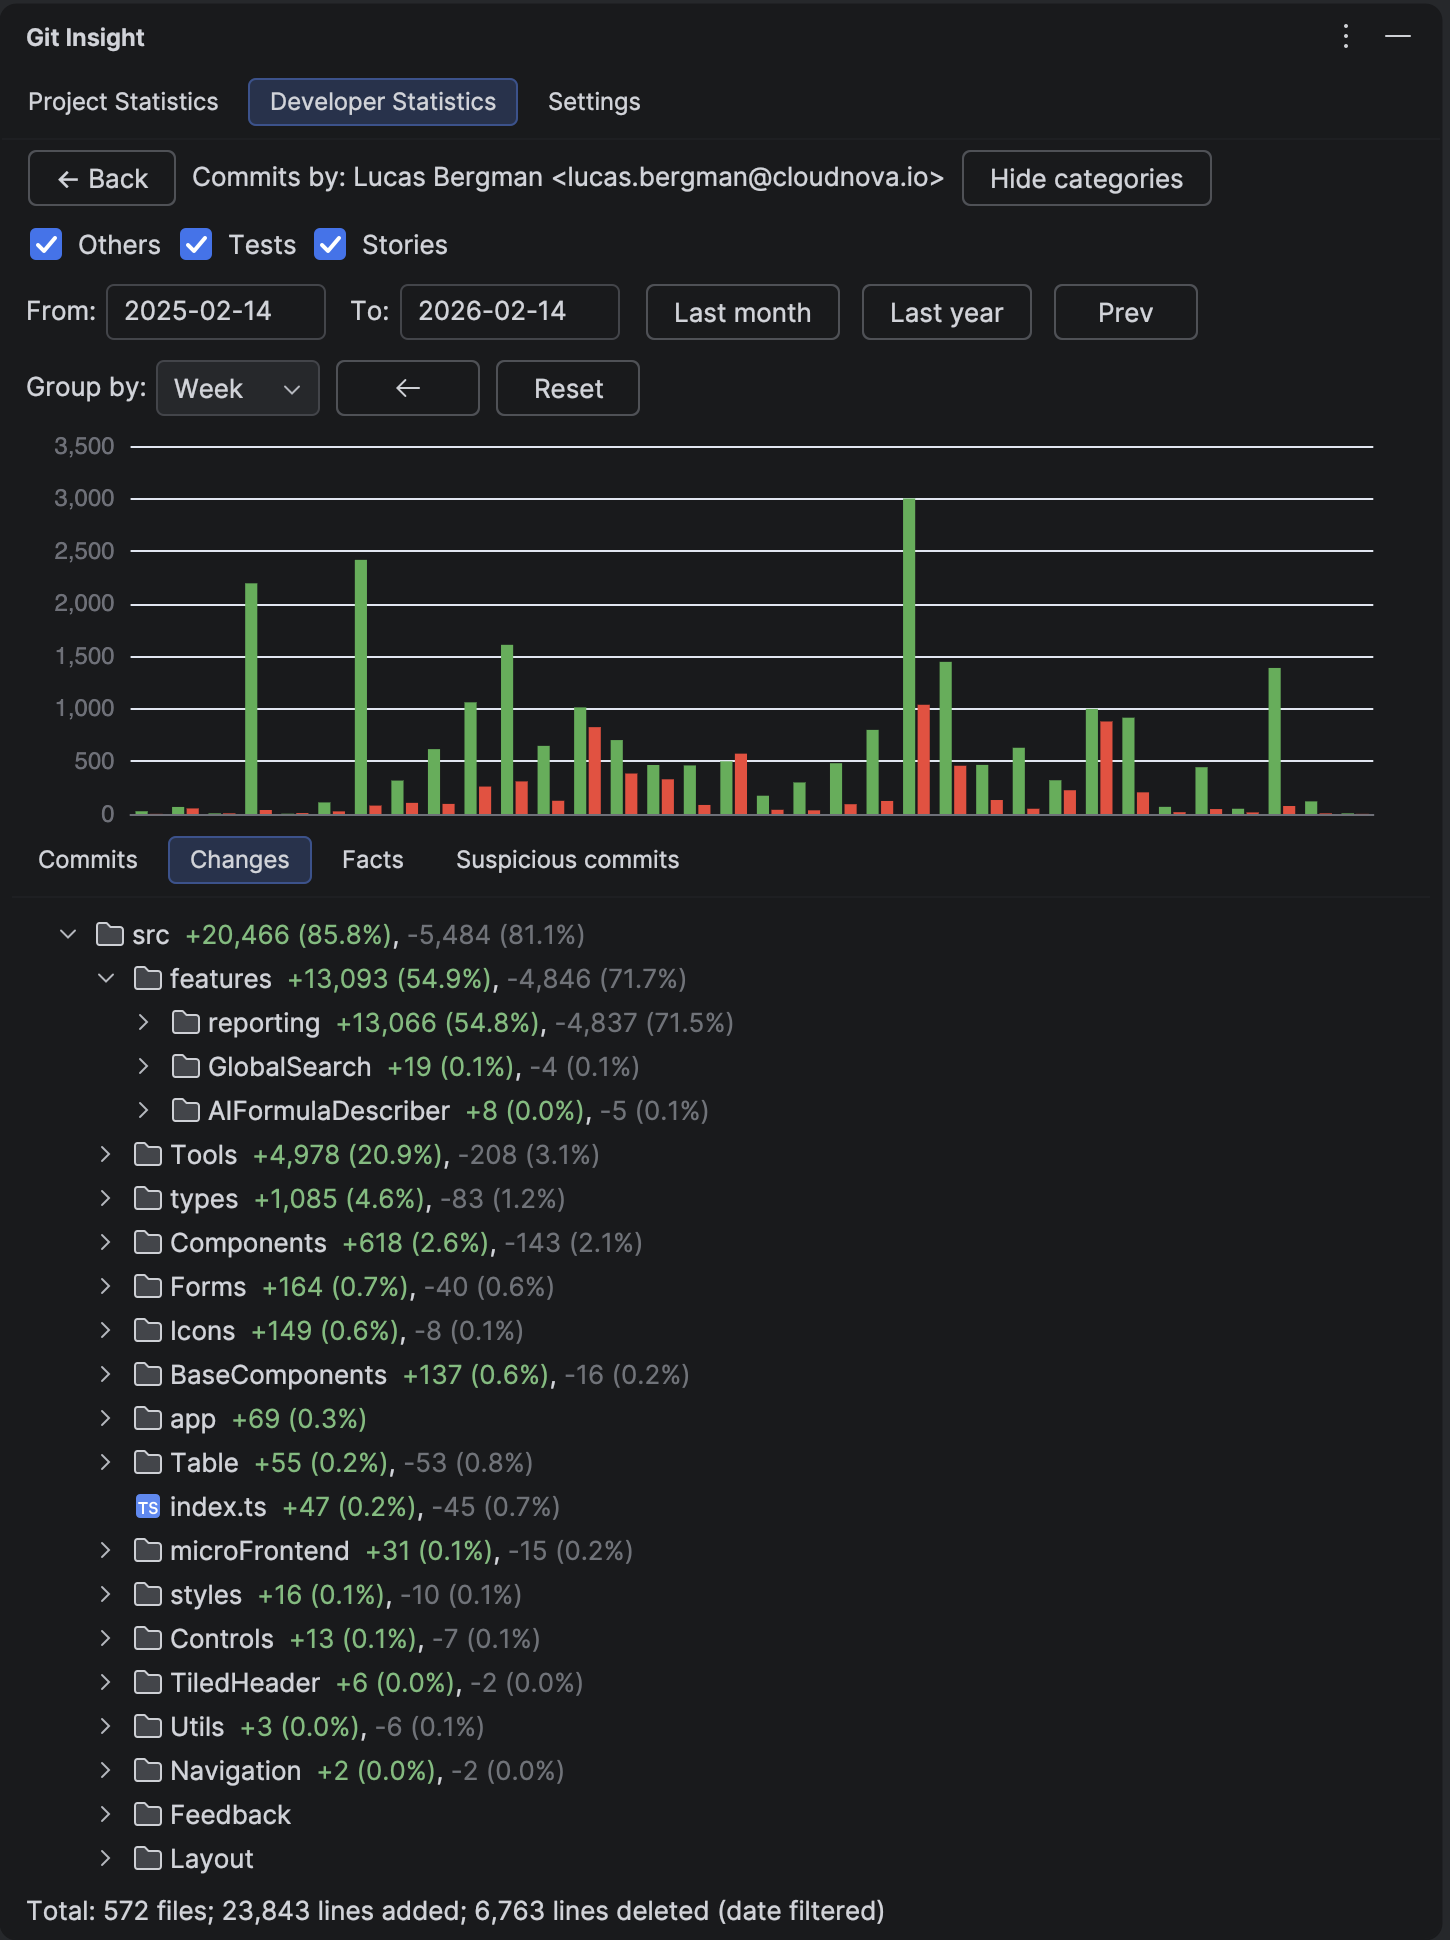
Developer Changes
Understand where in the codebase a developer focuses their work with aggregated file changes across commits.
Learn more →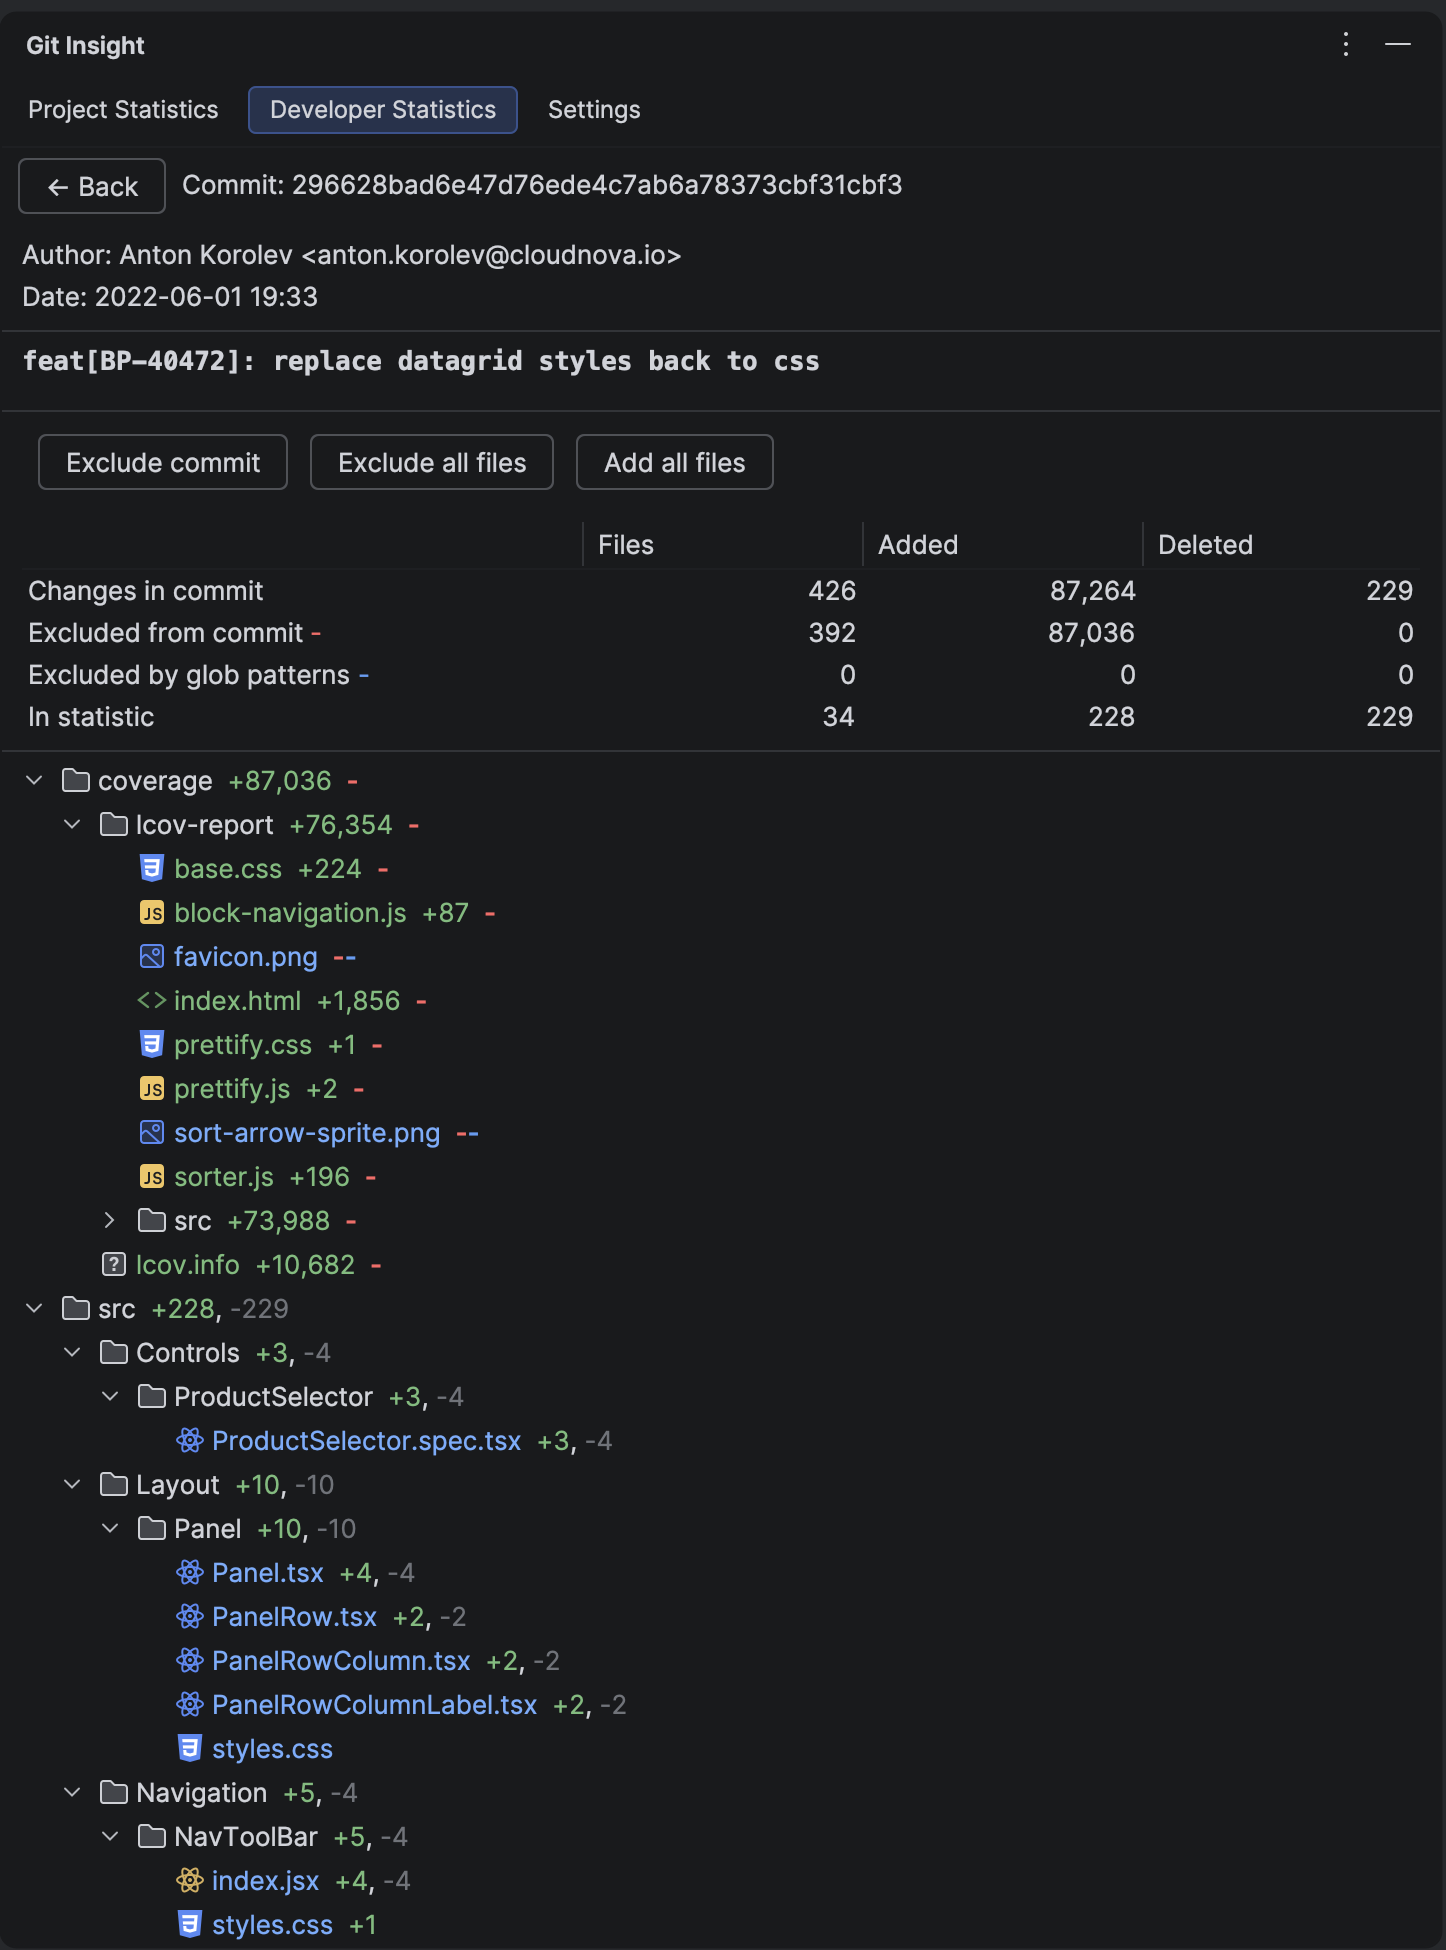
Commit Details
Inspect a single commit in full detail — see the complete message, all changed files, and open diffs in your IDE.
Learn more →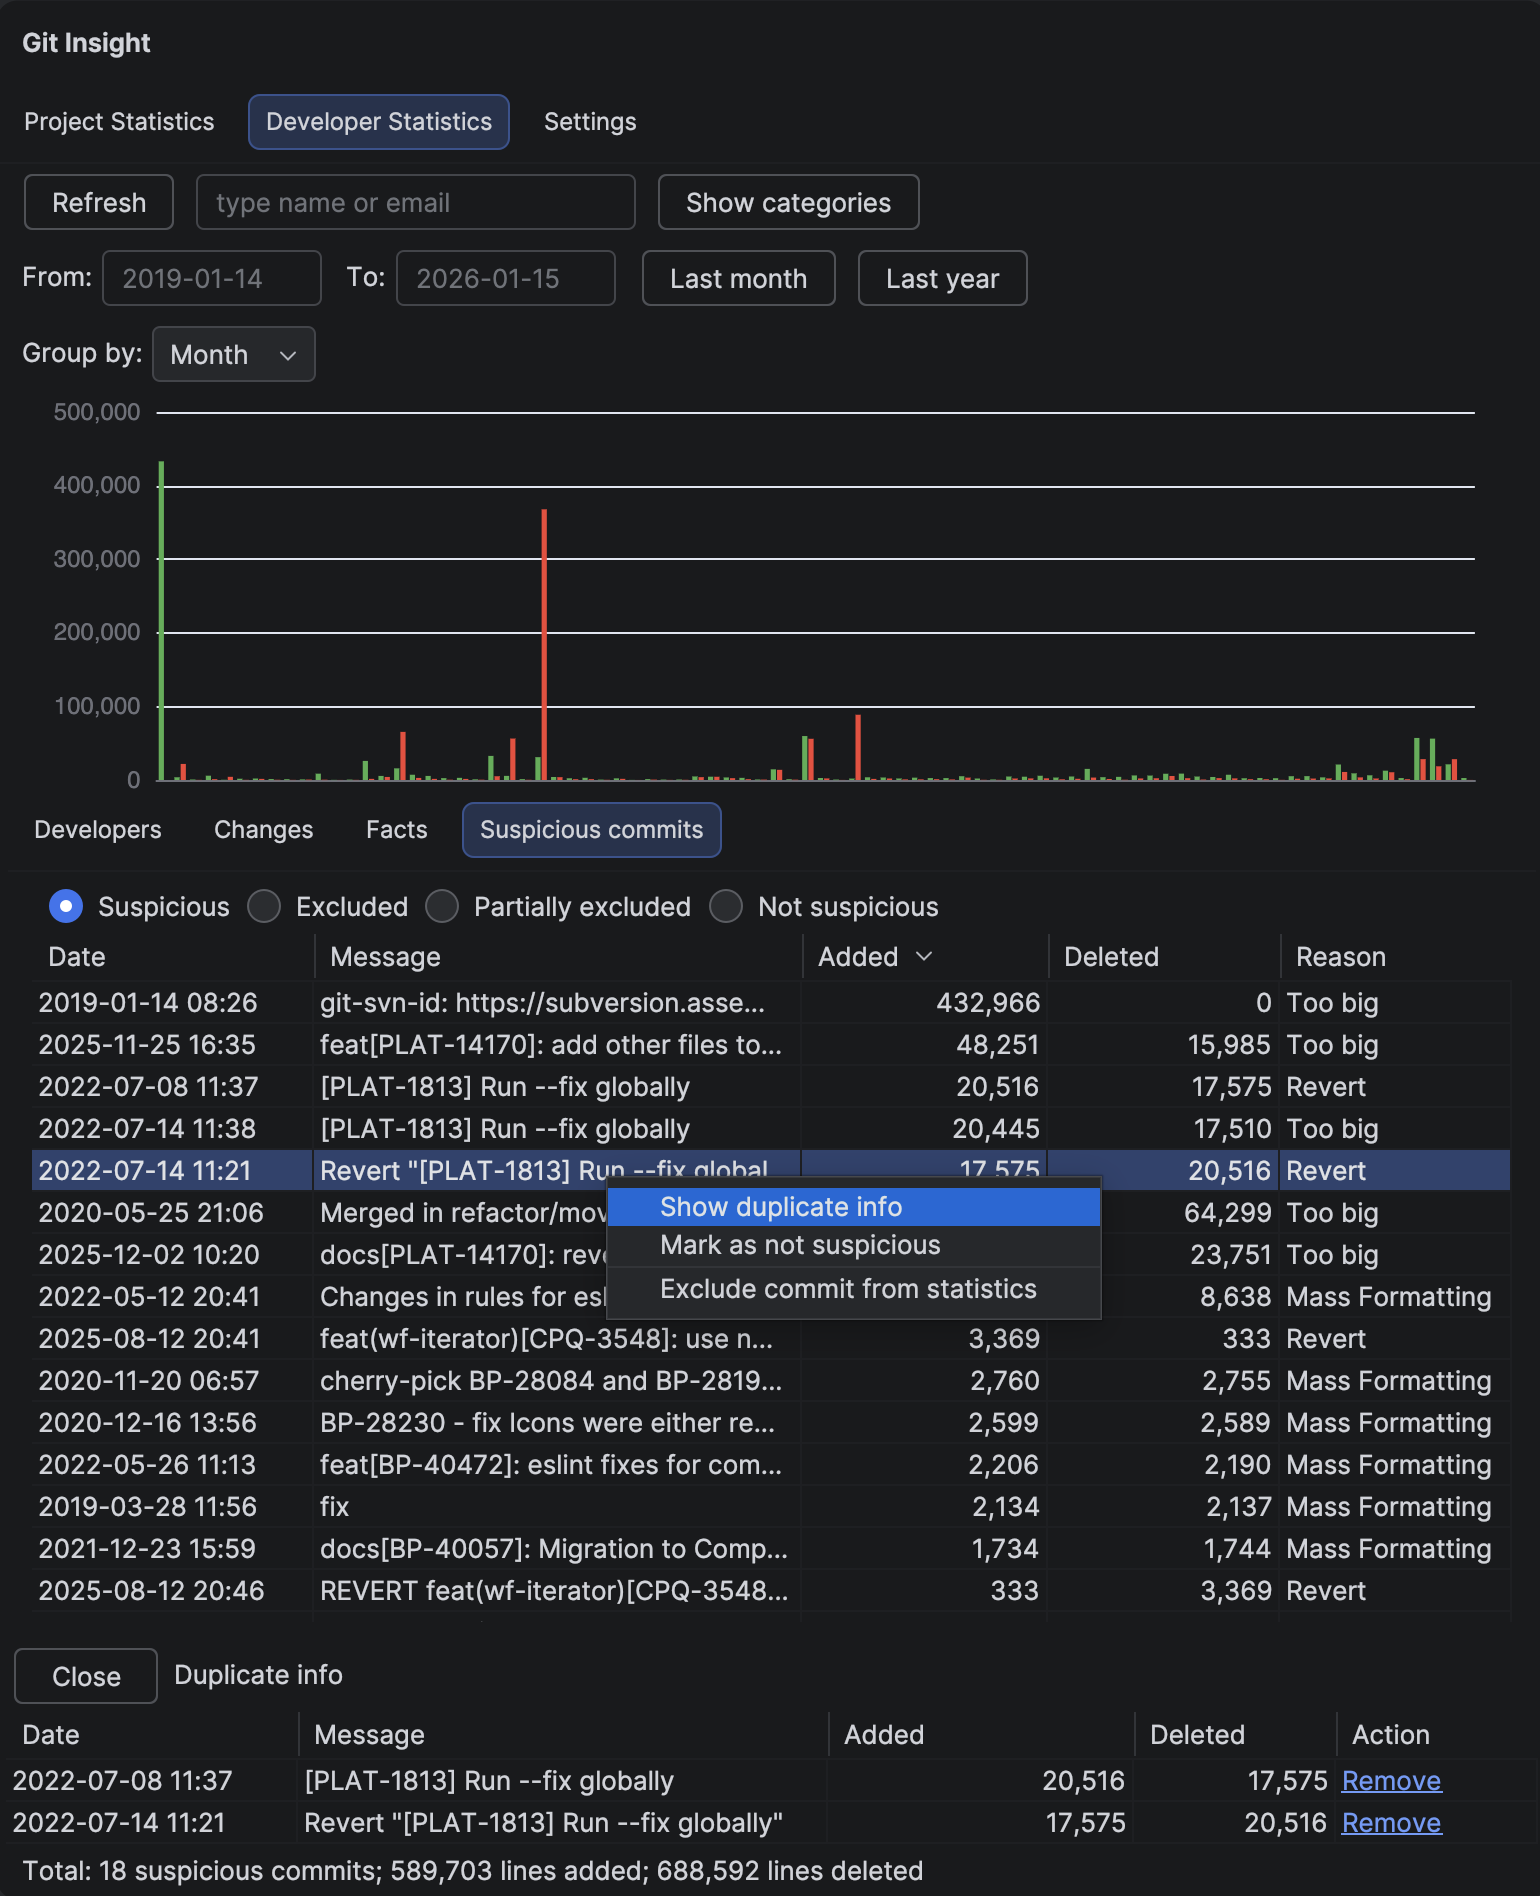
Suspicious Commits
Automatically detect commits that might skew statistics — mass formatting, duplicates, reverts, and large changes.
Learn more →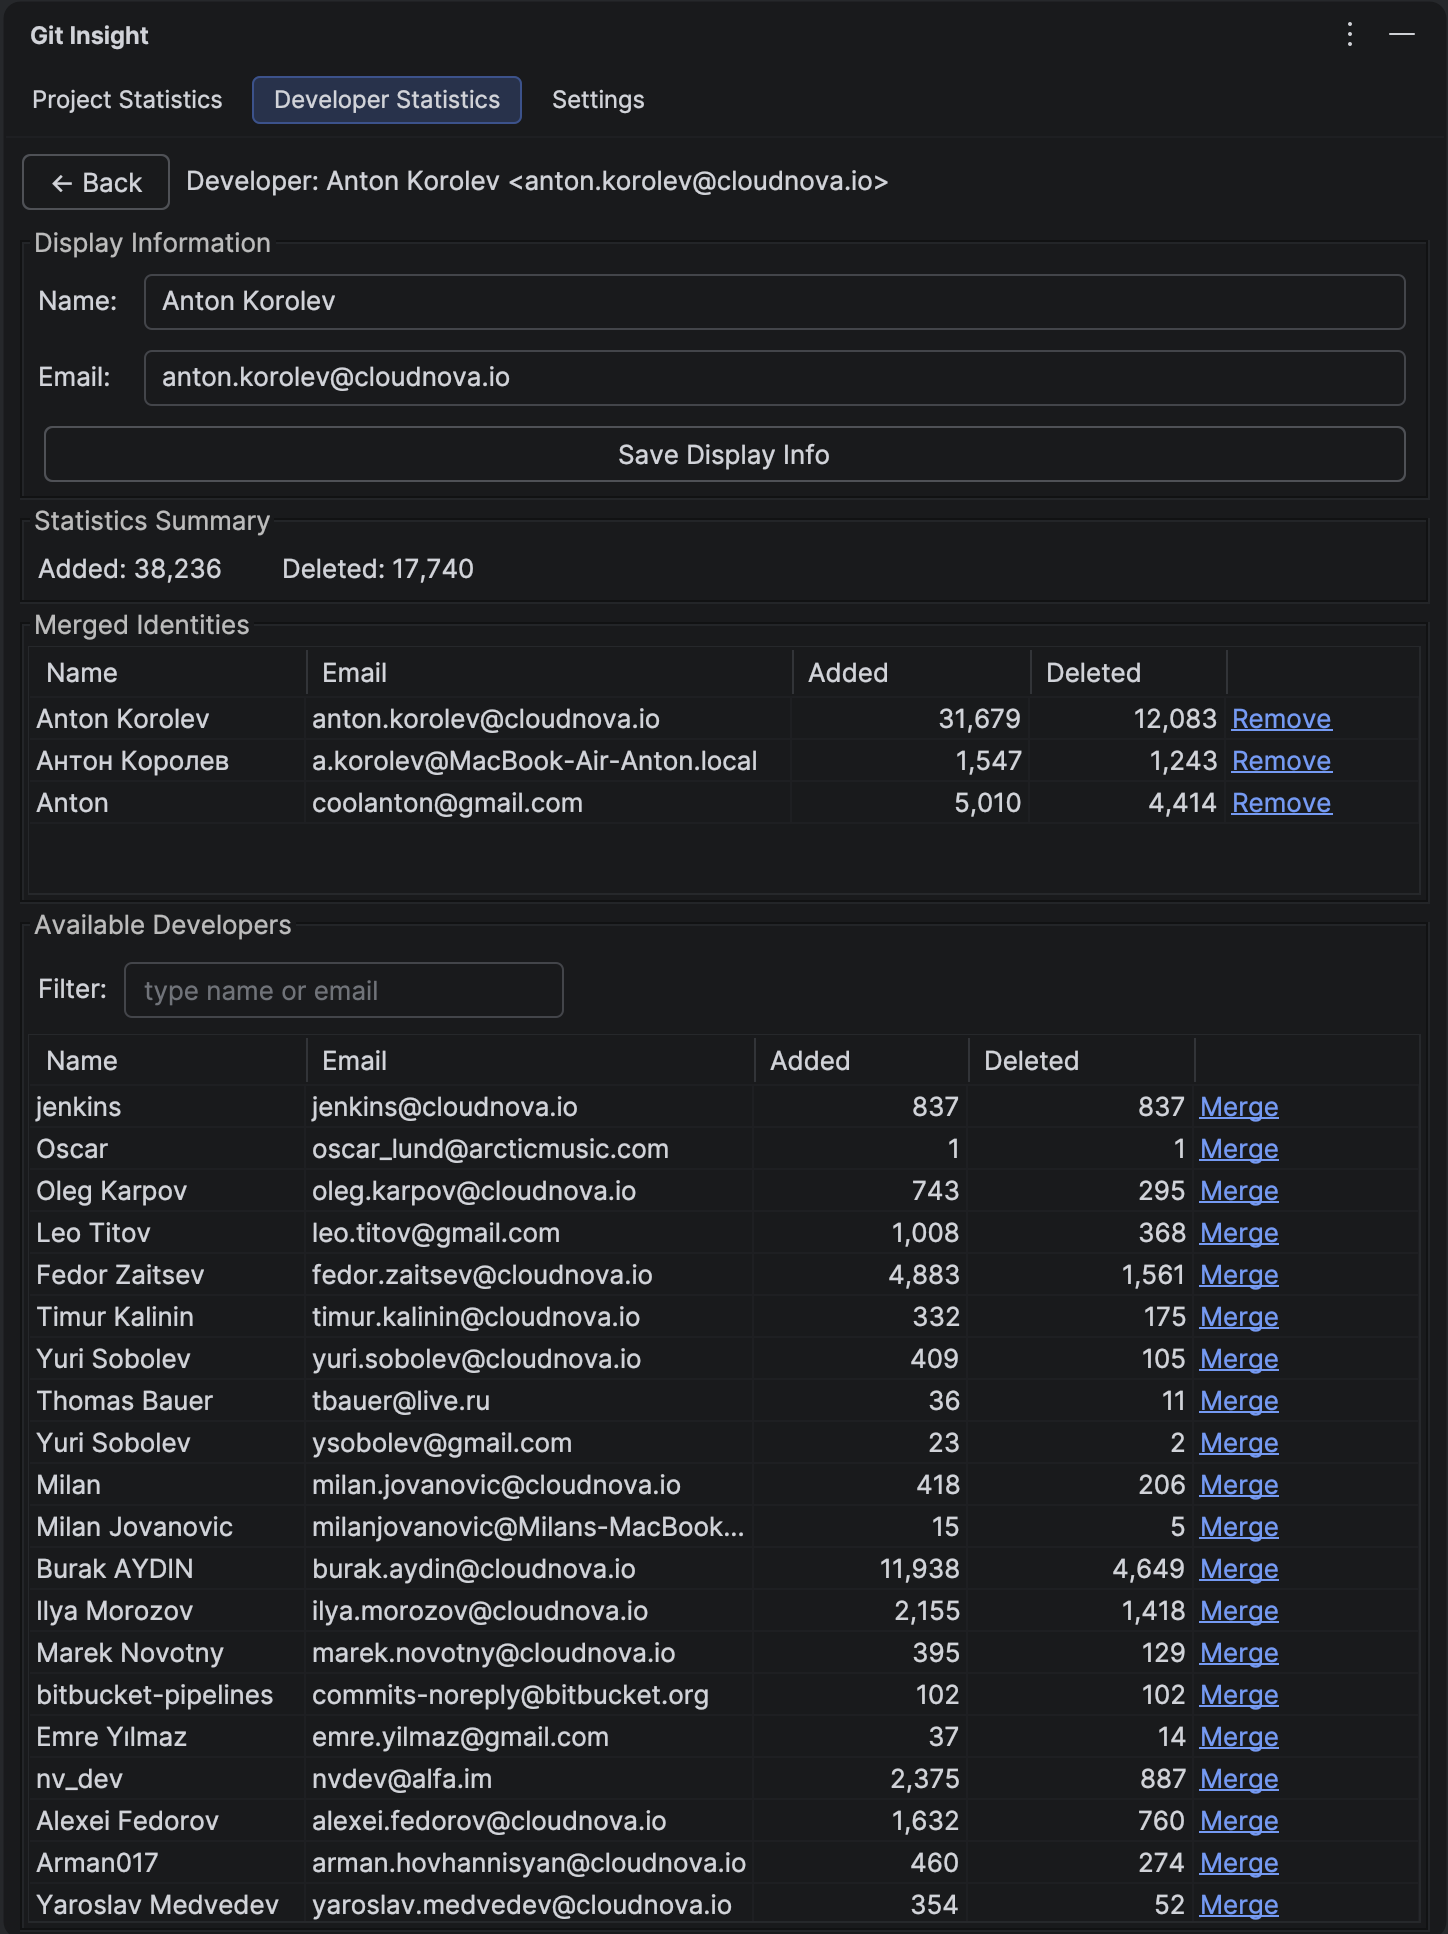
Merge Developers
Merge different Git identities (work laptop vs. personal, old email vs. new) to get accurate statistics per person.
Learn more →