Developer Statistics
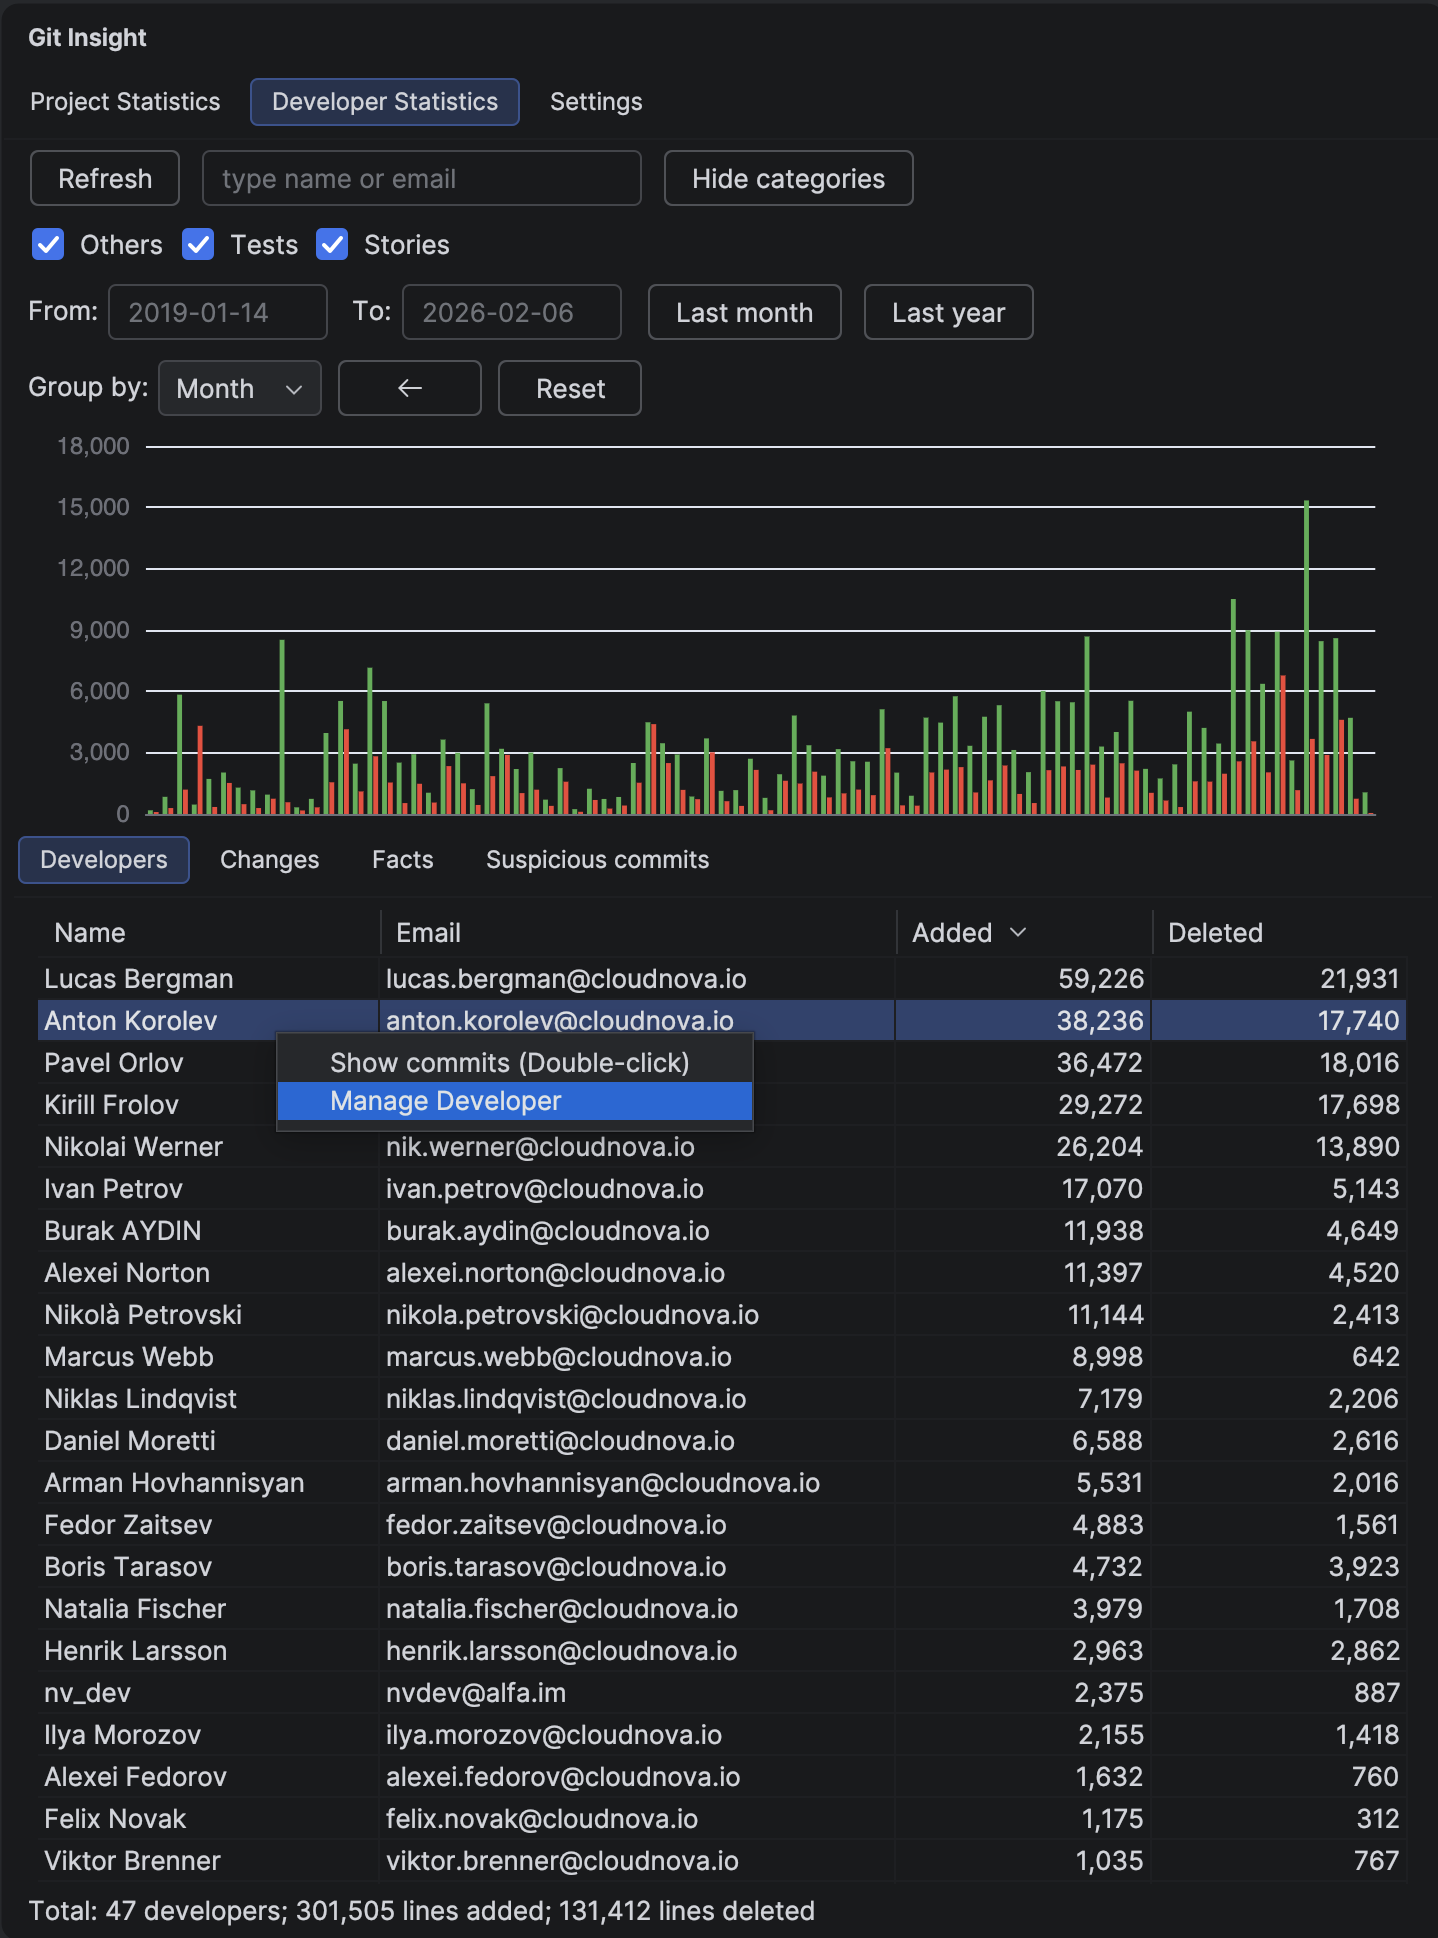
The central hub for understanding developer contributions. View aggregated statistics, filter by date ranges, and drill down into individual developer activity.
Key Features
- Contribution chart showing lines added/deleted over time
- Developer table with name, email, added, and deleted counts
- Date range filtering with quick buttons (Last month, Last year)
- Text search to filter by developer name or email
- Period selector (Day, Week, Month, Year) for chart granularity
- Multiple tabs: Developers, Changes, Facts, Suspicious commits
Understanding the Chart
The bar chart displays lines added (green) and deleted (red) over time. Use the period selector to switch between daily, weekly, monthly, or yearly views.
Chart Interactions
- Click a bar — drills down to a finer period and sets the date range
- Hover — shows exact counts and number of active developers
- Period selector — changes time grouping
- Prev/Next buttons — navigate through time periods
Filtering
Date Range
Enter dates in From/To fields or use quick buttons. The chart and table update in real-time.
Text Search
Type in the search field to filter developers by name or email. Supports partial matches and special characters.
Category Filter
The Categories button in the toolbar opens a popup with a checkbox per category plus quick actions All and None. The selection applies to every sub-tab and the totals row at the bottom of each table reports filtered values as a percentage of the unfiltered totals.
Repository Filter
The Repositories button appears in the toolbar once additional repositories are configured. Quick actions Only current and All, plus a checkbox per configured repository, scope statistics to one repo or aggregate across many. See Multi-Repository Support.
Team Filter
The Teams button appears in the toolbar once teams are configured. Selecting one or more teams filters every sub-tab (Developers, Commits, Changes, Facts, Suspicious) by team membership. See Developer Teams.
Tabs
Developers
The main table showing all contributors. Double-click a row to view that developer's commits.
Changes
A tree view showing which files were modified and by whom. See Developer Changes for details.
Facts
Key metrics like commits per period, average changes per developer, and velocity calculations. See Project Facts for details.
Suspicious commits
Lists commits flagged as potentially problematic (mass formatting, duplicates, etc.). See Suspicious Commits for details.
Context Menu Actions
Right-click on a developer row for additional options:
- Show commits — same as double-click
- Manage Developer — opens Merge Developers panel
- Merge to [Developer] — quick merge when multiple developers are selected
Tip
Using Git Insight for performance reviews? See our step-by-step guide: Git Analytics for Performance Reviews
Tip
For accurate productivity comparisons, analyze periods of 6 months or more. Shorter periods may be skewed by vacations, feature branches not yet merged, or different task types.