Getting Started
Git Insight works out of the box — install it and you'll immediately see statistics for your repository. But spending about 10 minutes on basic preparation will make your analytics significantly more accurate by removing noise from the data.
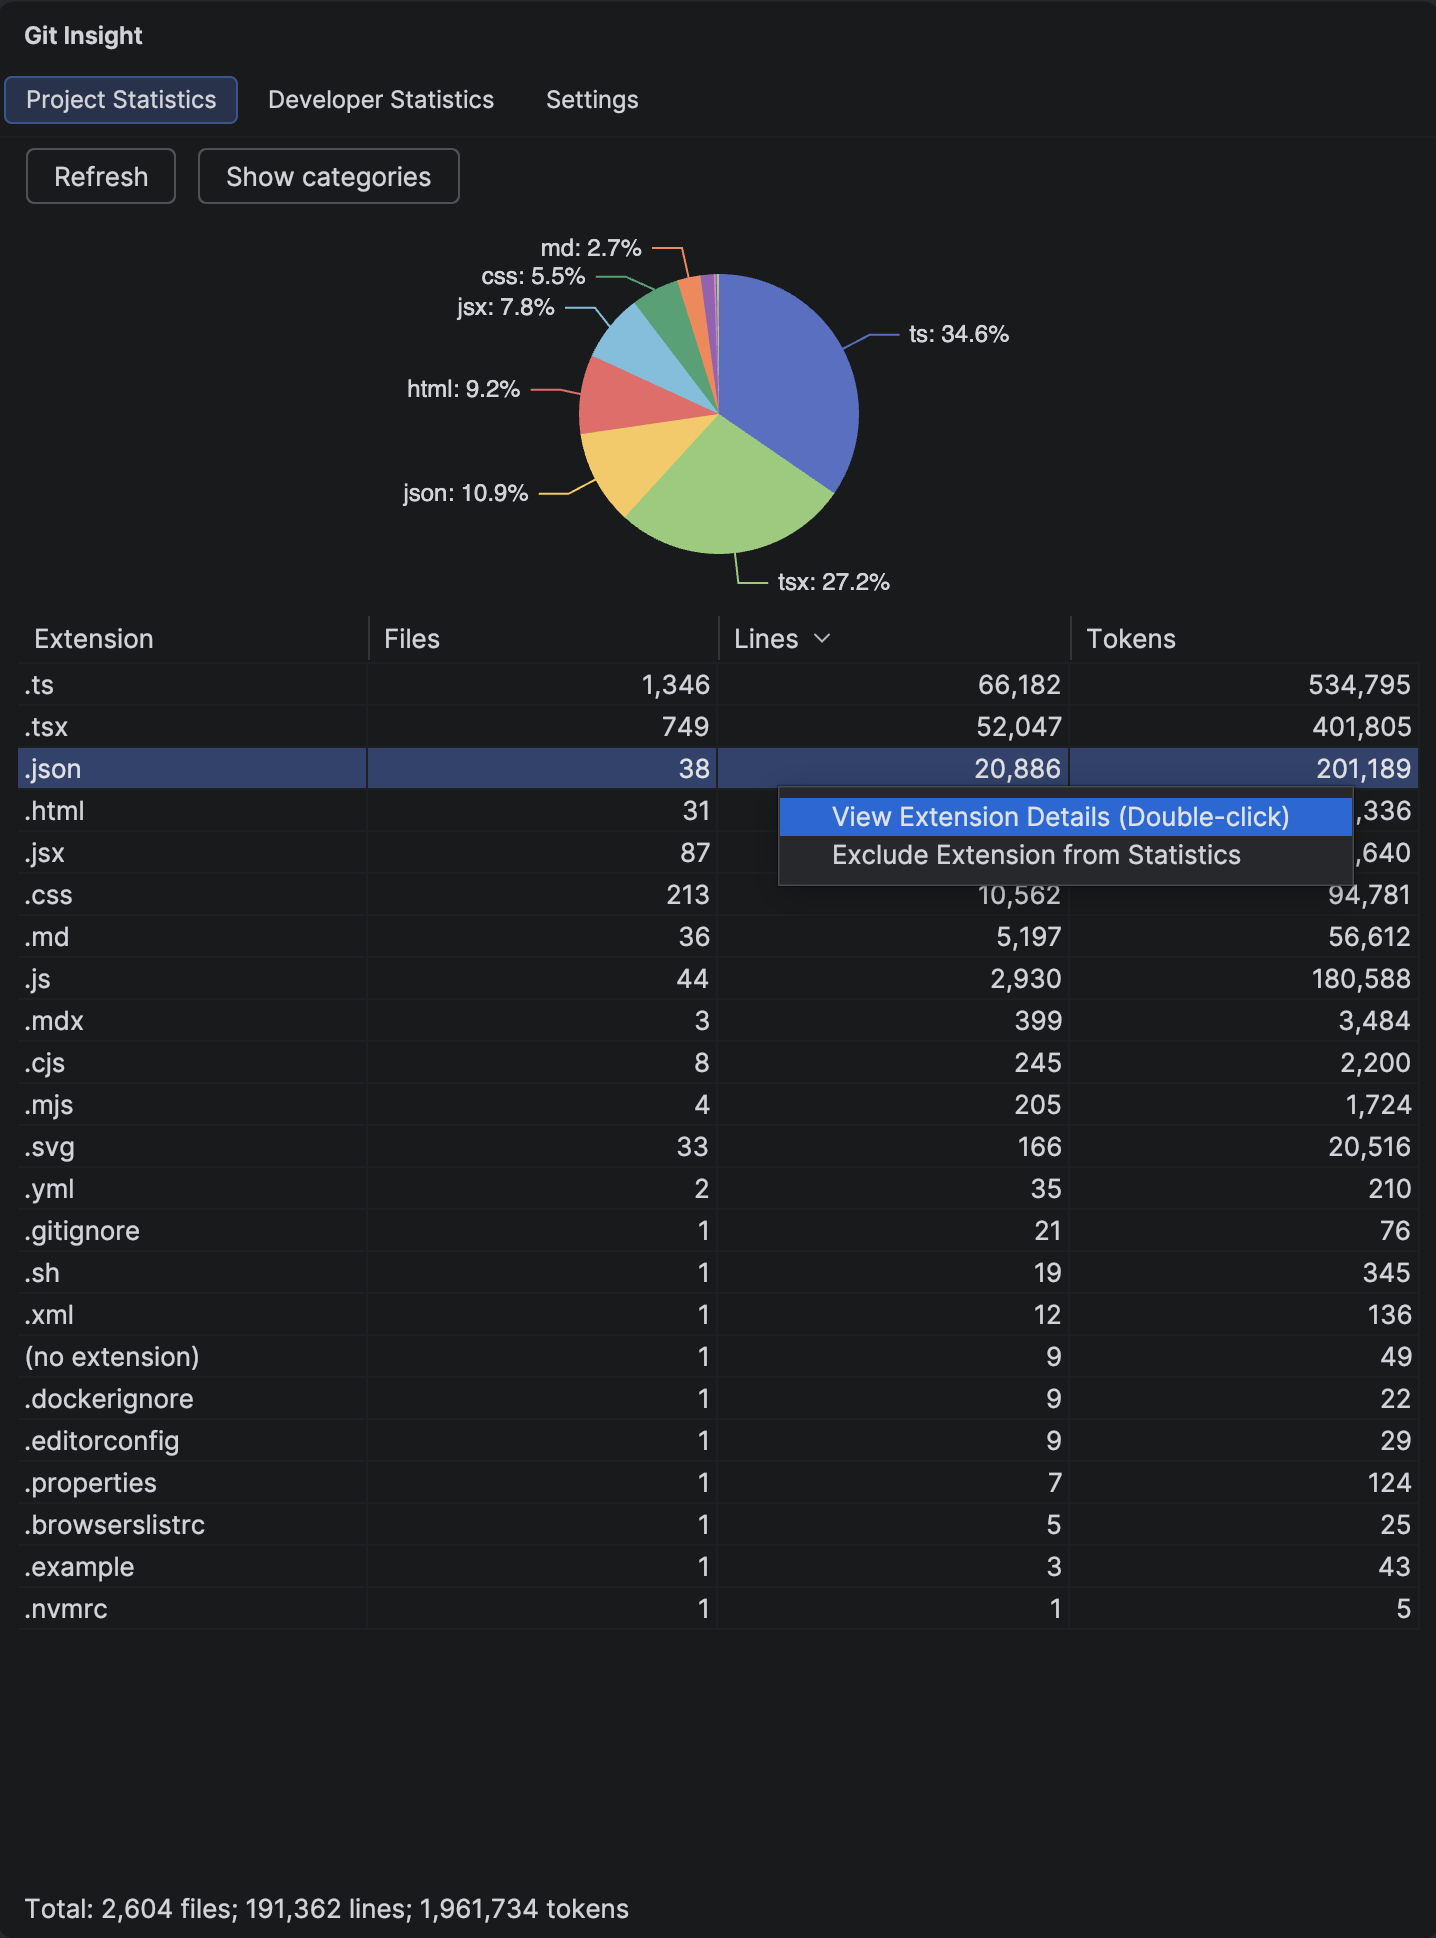
1 Review File Extensions
Open the Project Statistics tab and look at the pie chart. You'll likely see extensions that aren't real source code — .json, .xml, .svg, lock files, and other data formats that inflate line counts.
Right-click any extension in the chart or table and select "Exclude extension" to remove it from all statistics.
Tip
Git Insight includes 101 built-in patterns that already exclude common non-code files (images, fonts, binaries). You only need to exclude extensions specific to your project.
2 Exclude Large Auto-Generated Files
Some extensions contain a mix of real code and generated files. Double-click an extension in the pie chart to open Extension Details, where you can see individual files sorted by size.
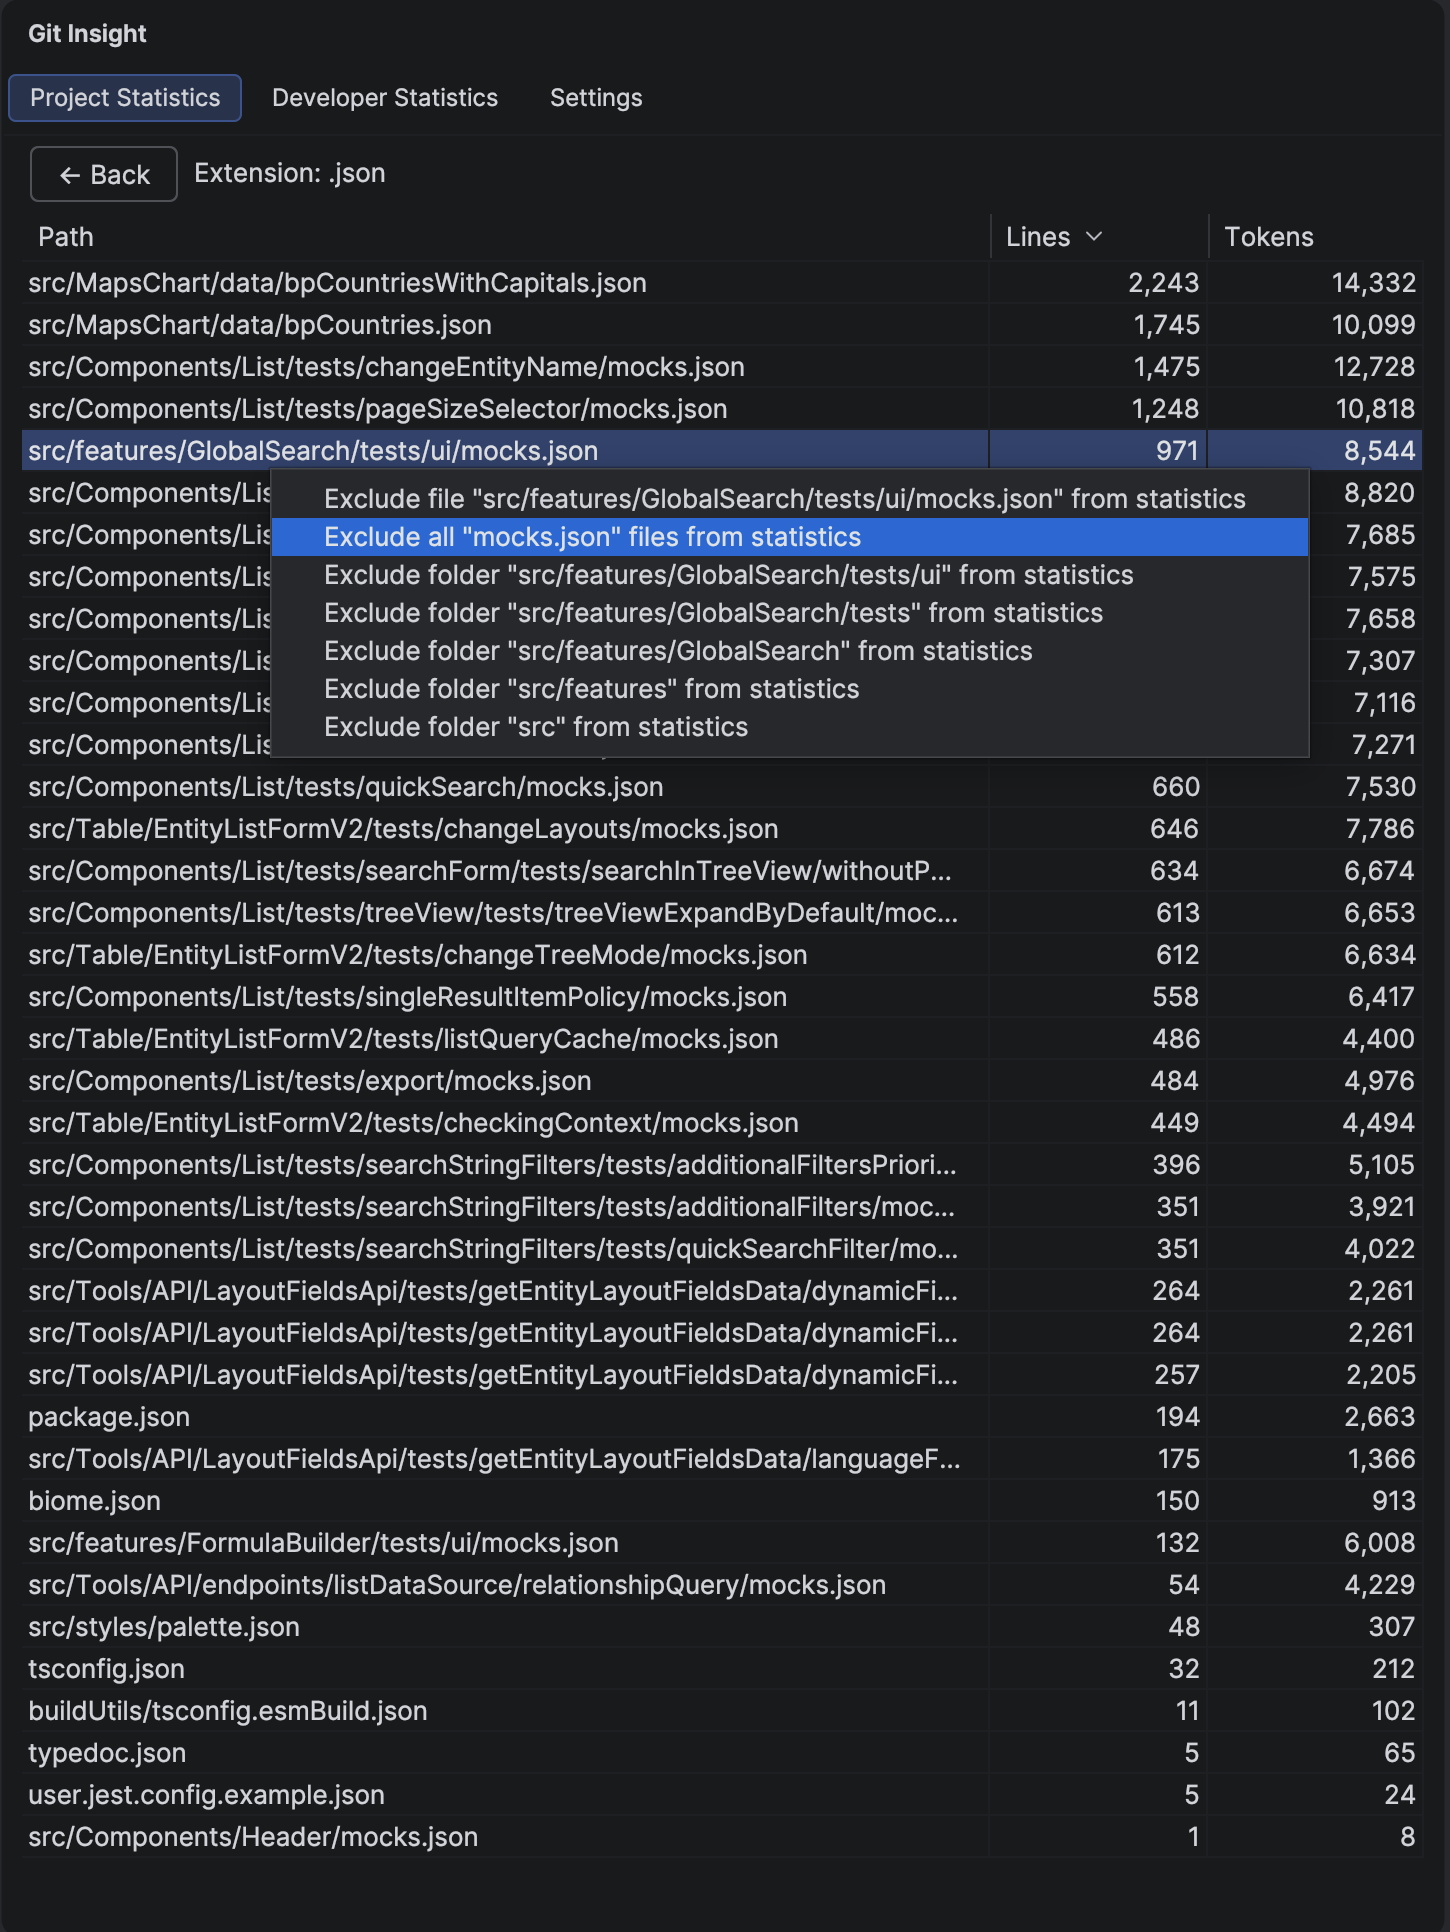
Right-click any file to see exclusion options:
- Exclude exact file — removes this specific file path
- Exclude by name — removes all files with this name in any directory
- Exclude by folder — removes all files in the containing directory
Tip
Start with the broadest exclusion that makes sense. Excluding by folder is often better than excluding files one by one — it will also catch future additions.
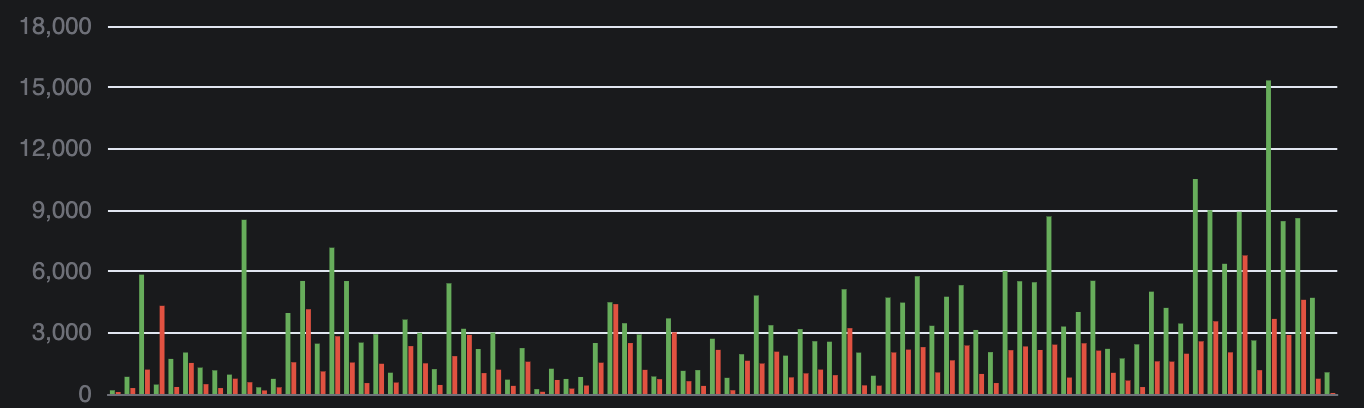
3 Handle Suspicious Commits
Switch to the Developer Statistics tab and look at the bar chart. You may notice some bars that are abnormally tall — these usually indicate mass formatting commits, generated code, or other bulk changes.
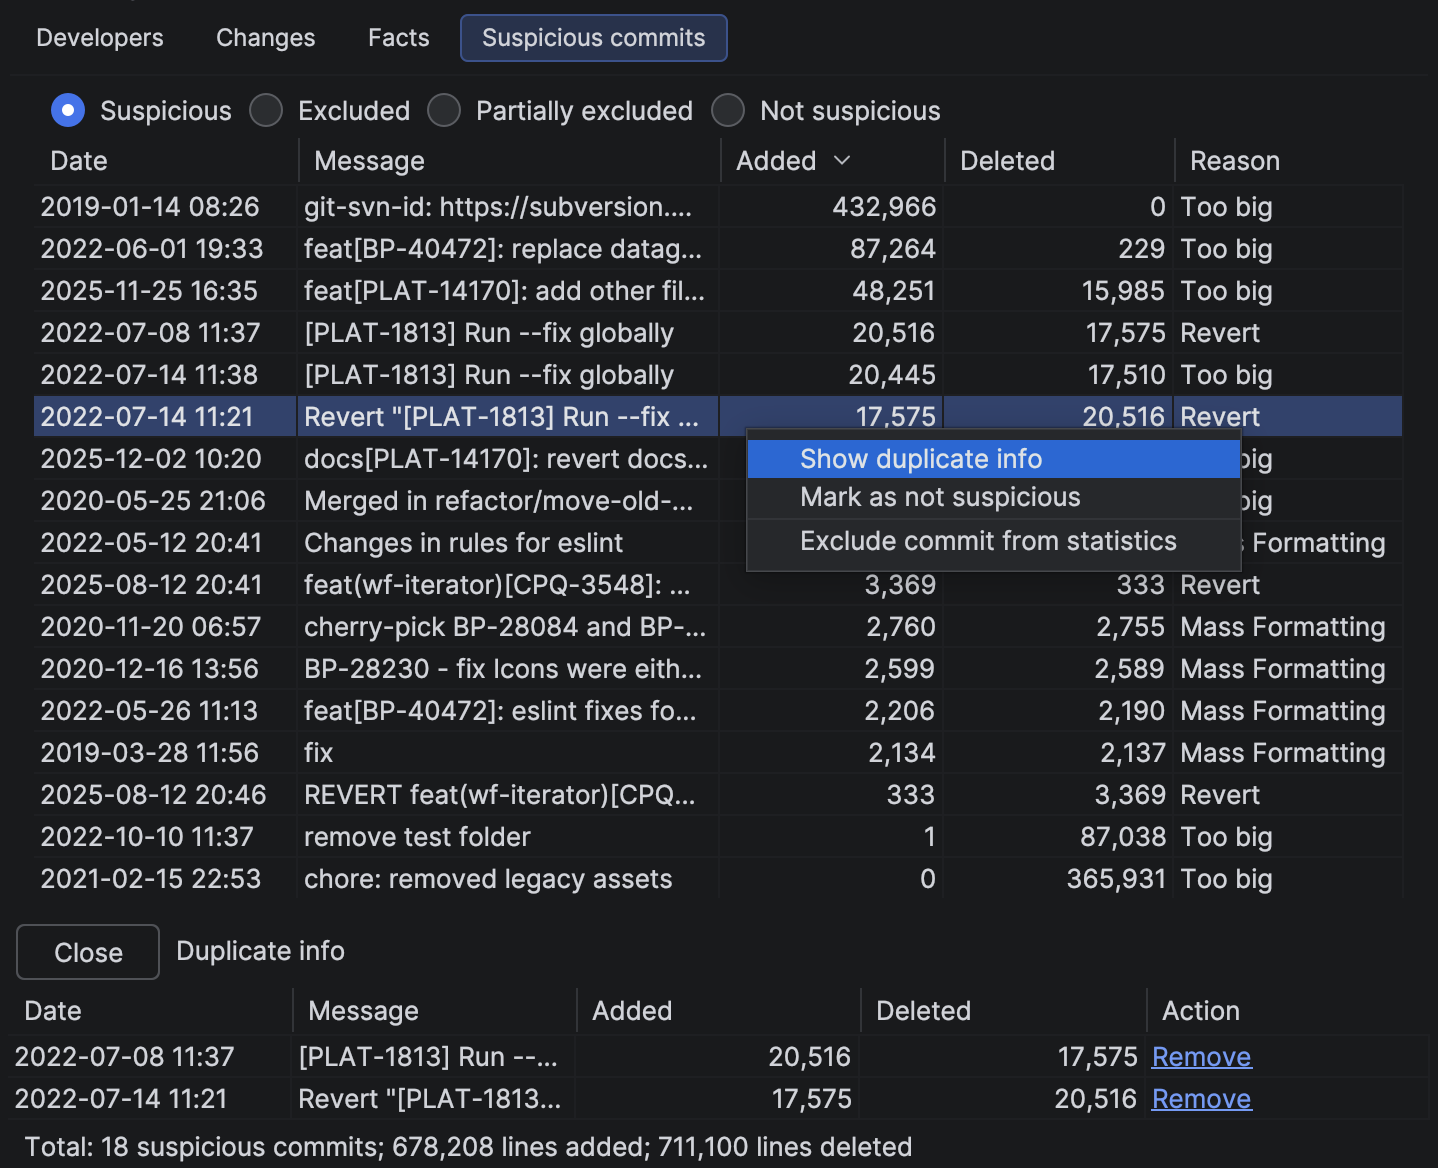
Click the "Suspicious commits" tab below the chart to see a list of automatically detected anomalies.
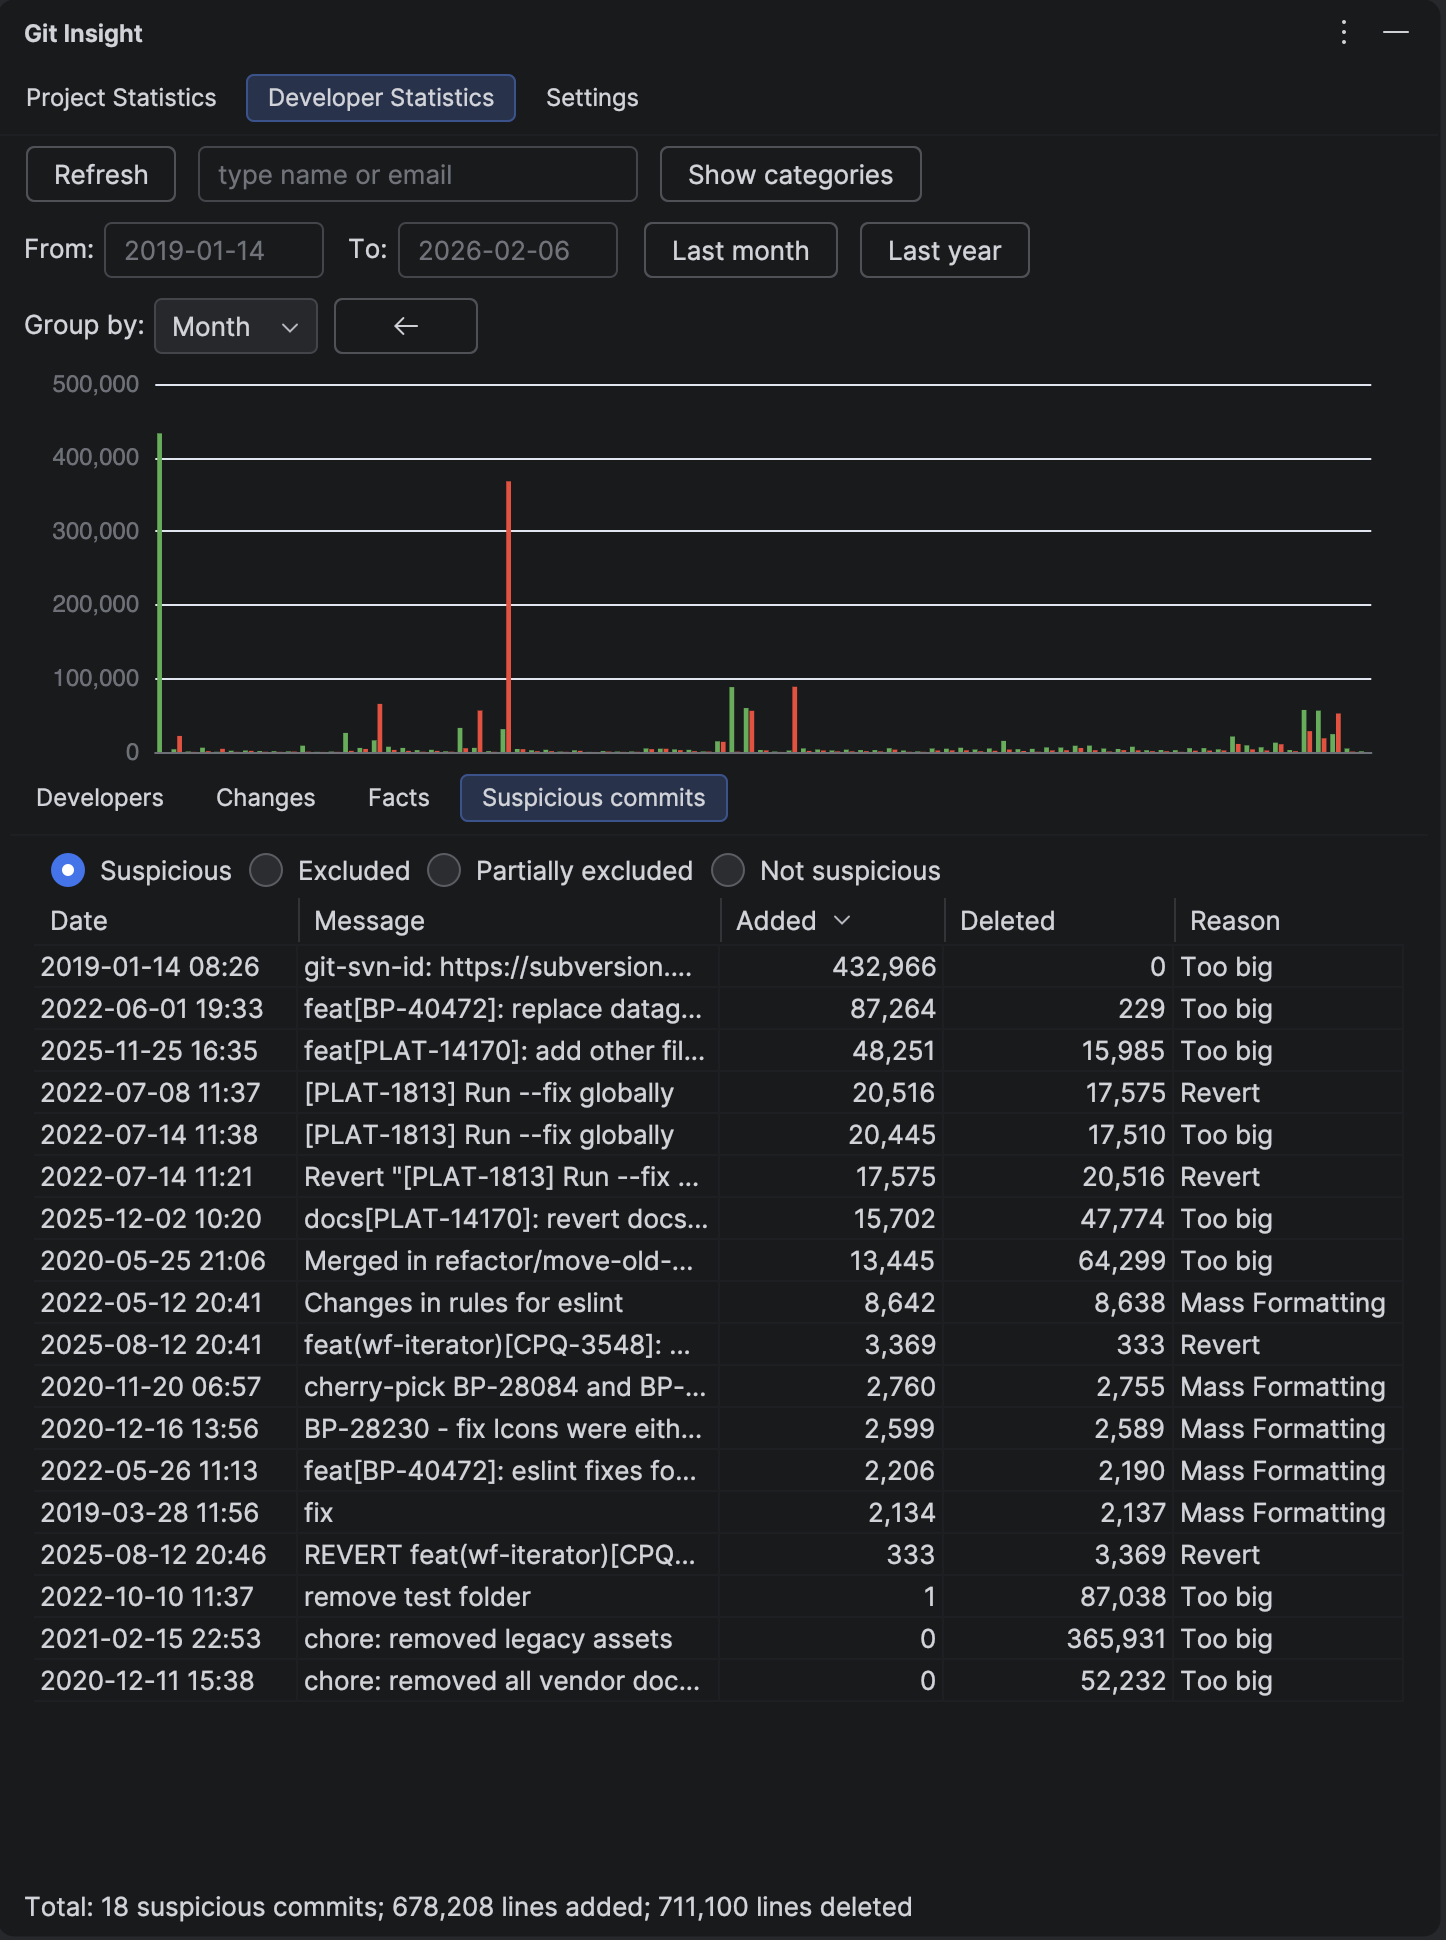
Review each suspicious commit and decide what to do:
- Exclude commit — removes it from all statistics
- Mark as not suspicious — keeps it in statistics and hides the flag
- Show duplicate info — for duplicate/revert types, shows a side-by-side comparison
See the Difference
After cleaning up suspicious commits, the bar chart becomes much more representative. Anomalous spikes disappear, and you can clearly see actual development patterns.
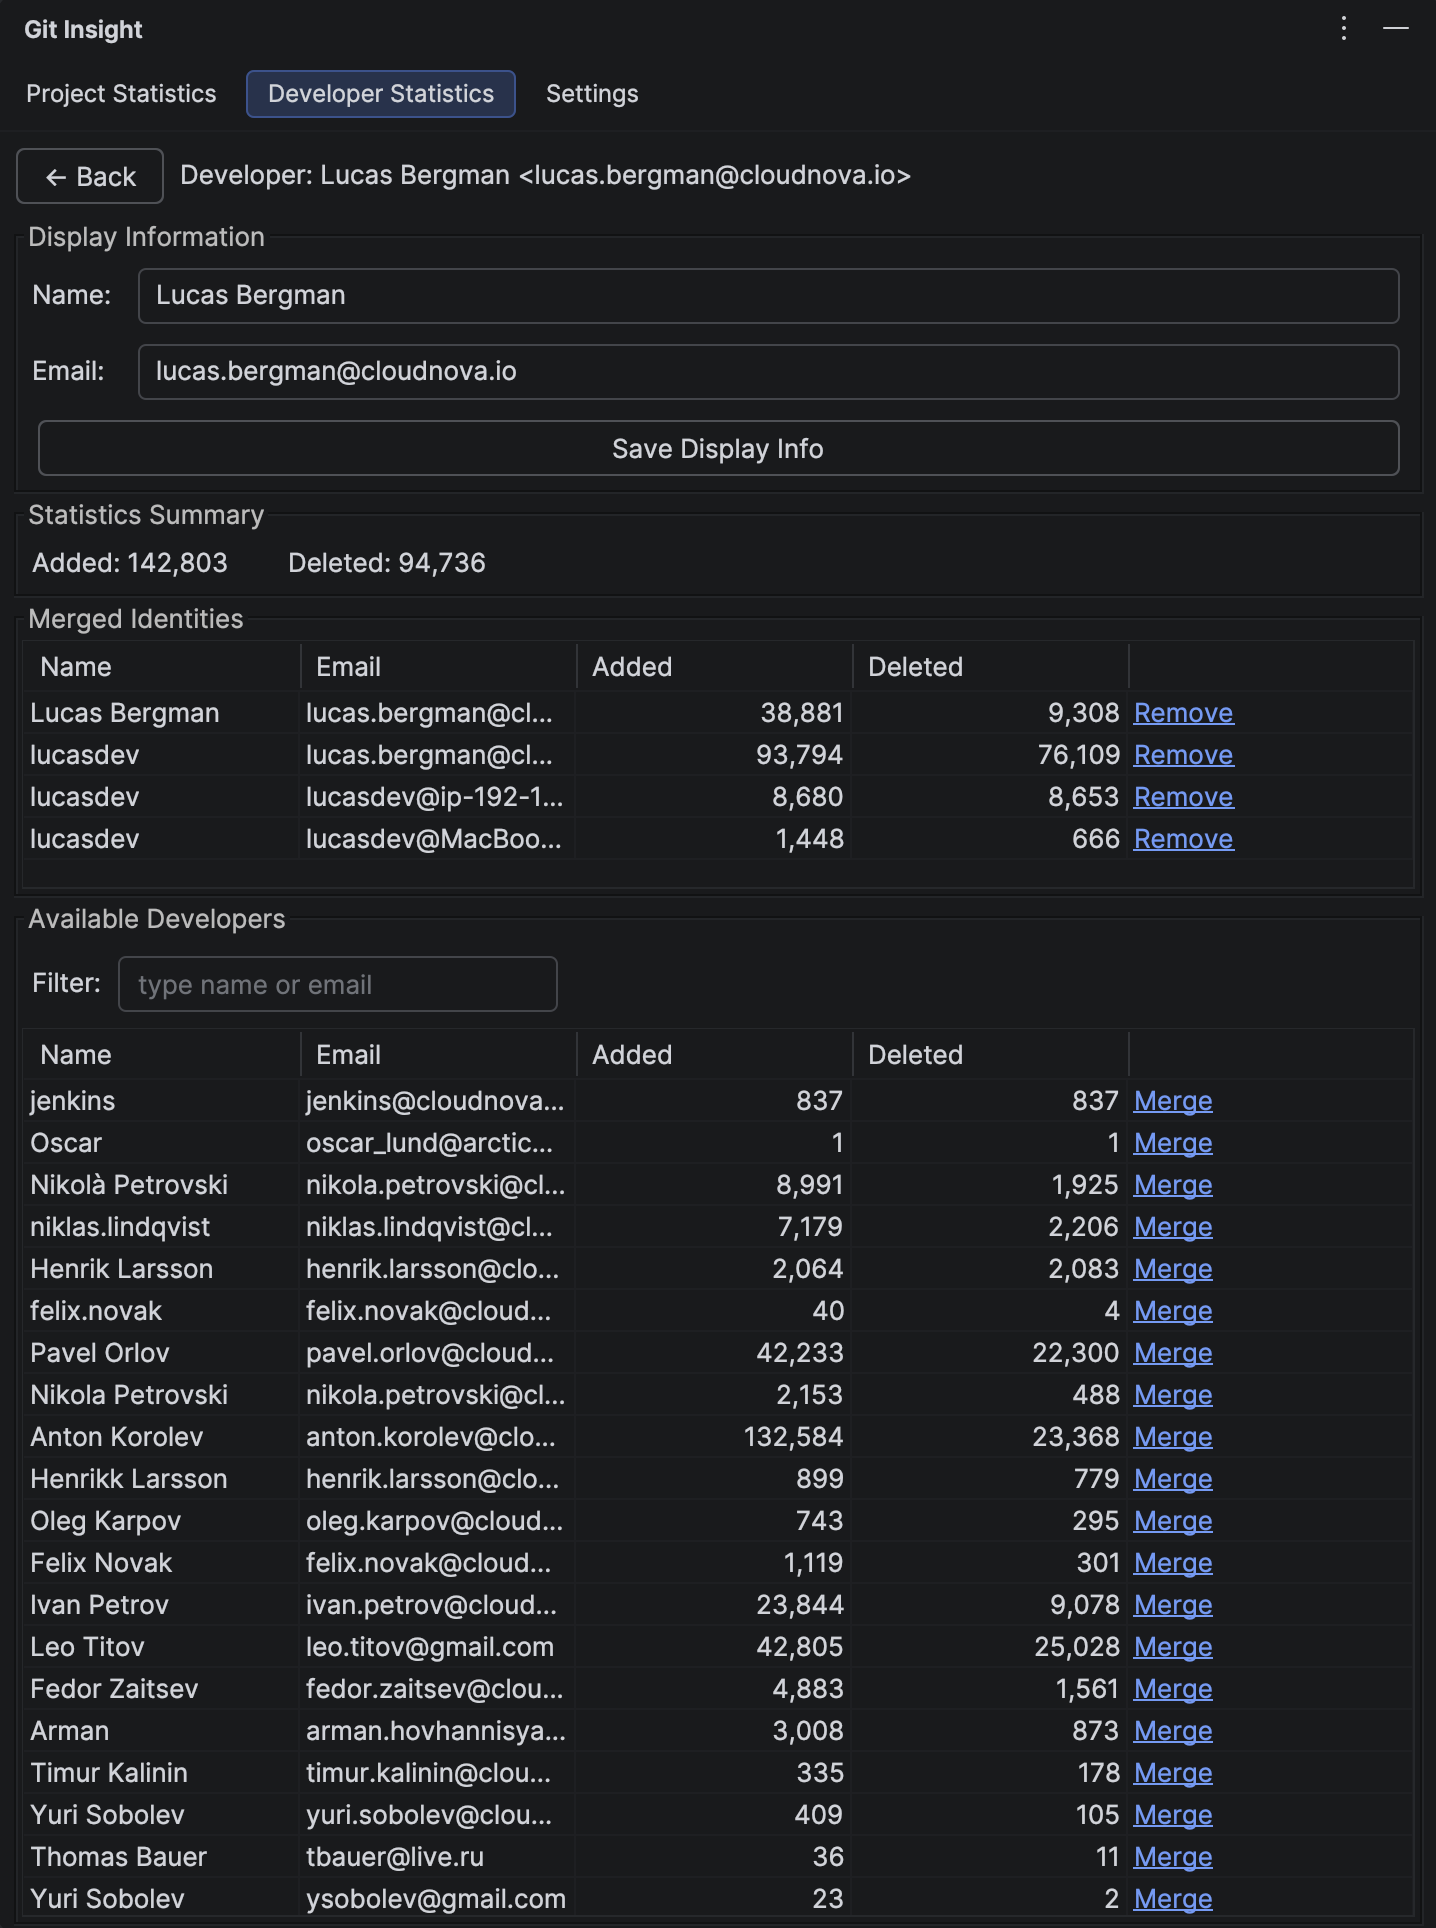
4 Merge Developer Accounts
Developers often commit from different Git identities — work laptop, personal machine, different email configurations. This creates duplicate entries in the statistics.
In the Developer Statistics table, right-click a duplicate developer and select "Merge to..." to combine their contributions under one identity.
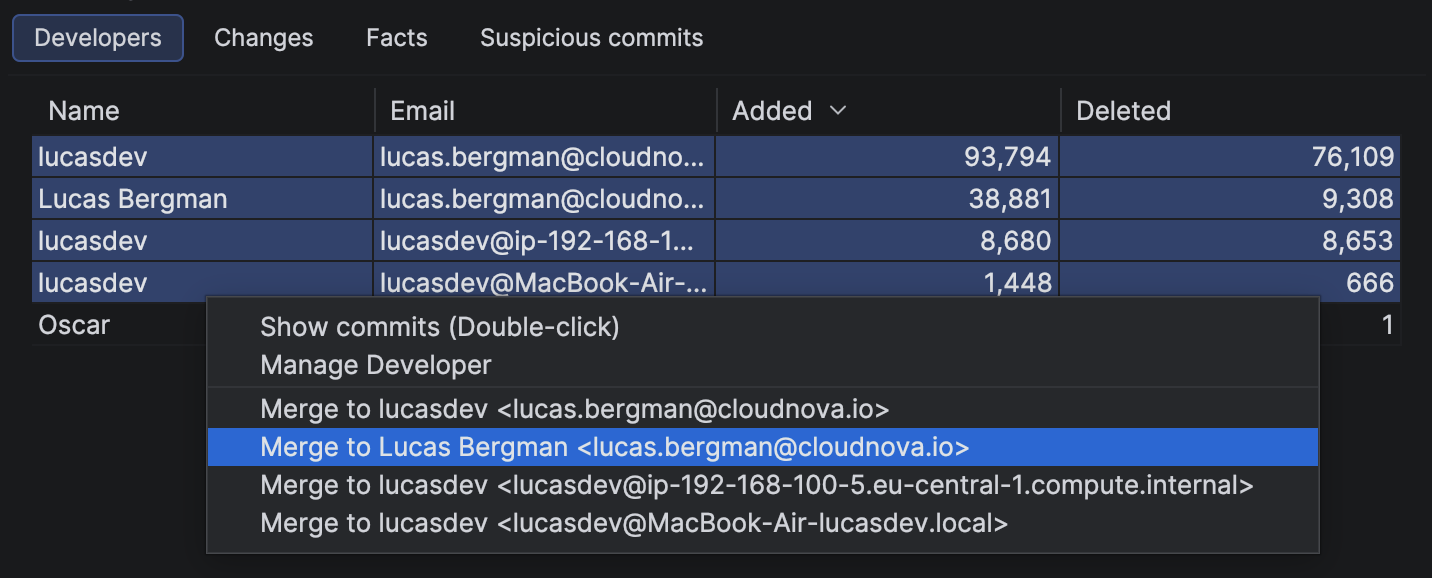
For complex merges involving many identities, use the dedicated Merge Developers panel. It shows all detected identities and lets you manage merges in bulk.
Basic Preparation Complete
After these 4 steps, your analytics should be significantly cleaner. Here's what you've achieved:
- Excluded non-code file extensions from line counts
- Removed large auto-generated files that skew statistics
- Cleaned up suspicious commits (formatting, duplicates, reverts)
- Merged duplicate developer identities into single profiles
Share Configuration with Your Team
All exclusion rules and merge settings are stored in .idea/gitInsight.xml. Commit this file to your repository so every team member gets the same clean statistics without repeating the setup.
Optional: Deep Cleaning
Sometimes the problem isn't the entire commit — it's a single folder or file inside it. Instead of excluding the whole commit (and losing real code changes), you can exclude just the noisy part. Here's a real example.
Spot the Anomaly
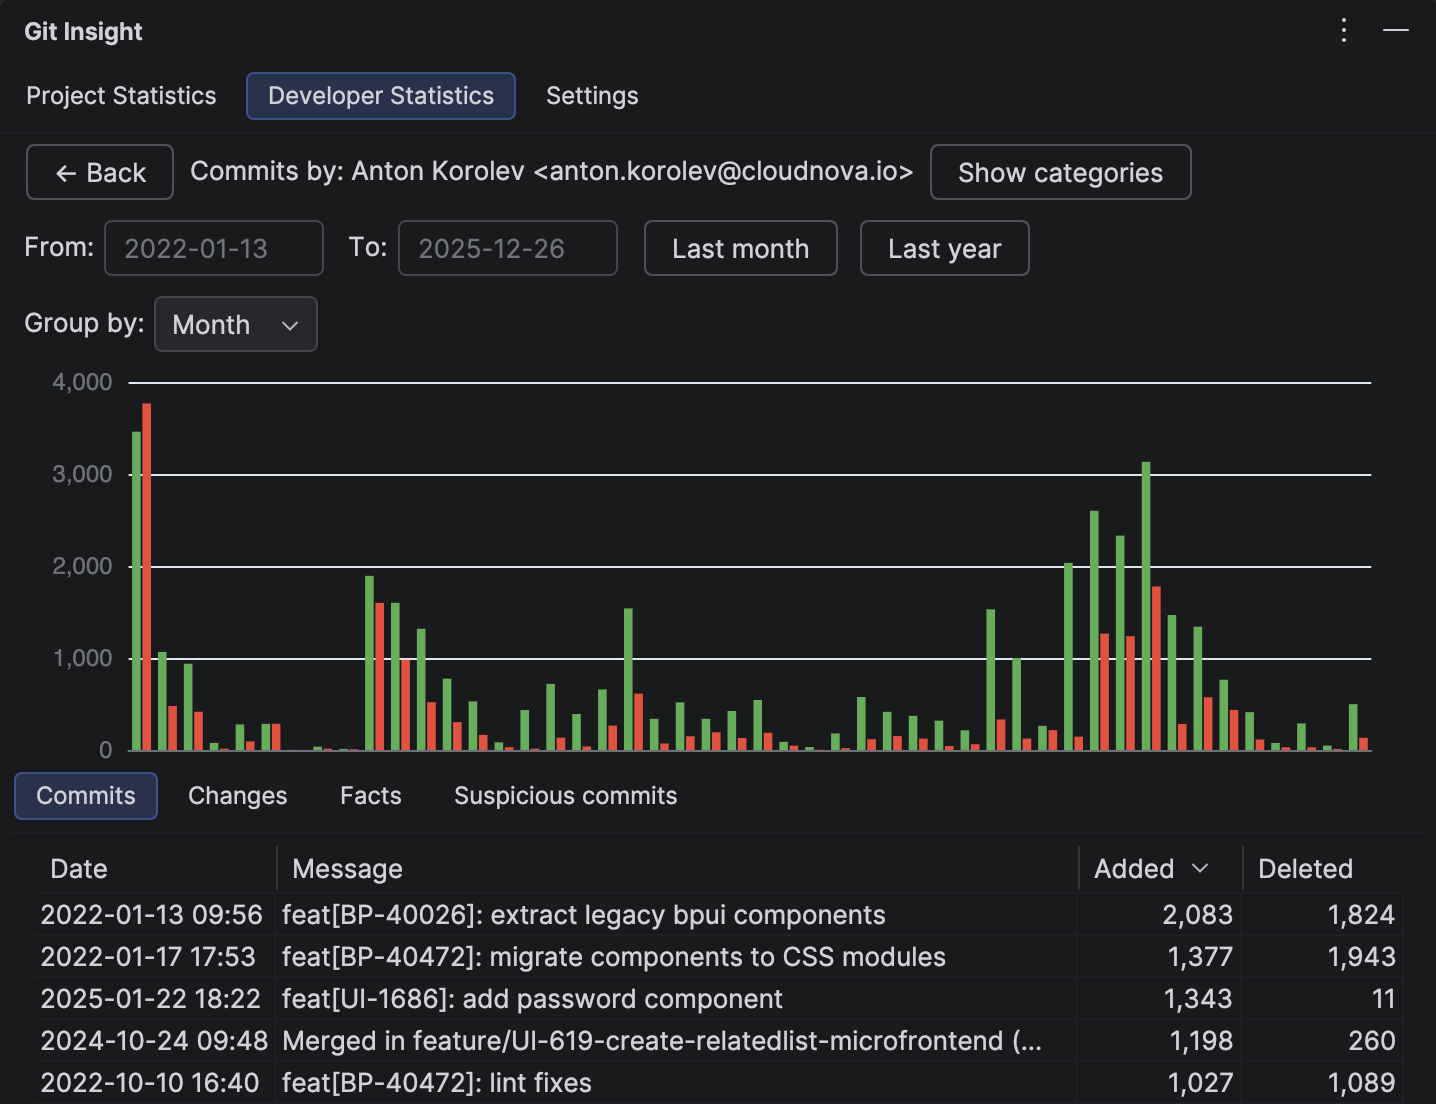
Open the Developer Commits page and look at the bar chart. In this project, there's a massive spike in June 2022 — 87,320 lines added in a single commit. That's clearly not normal development work.
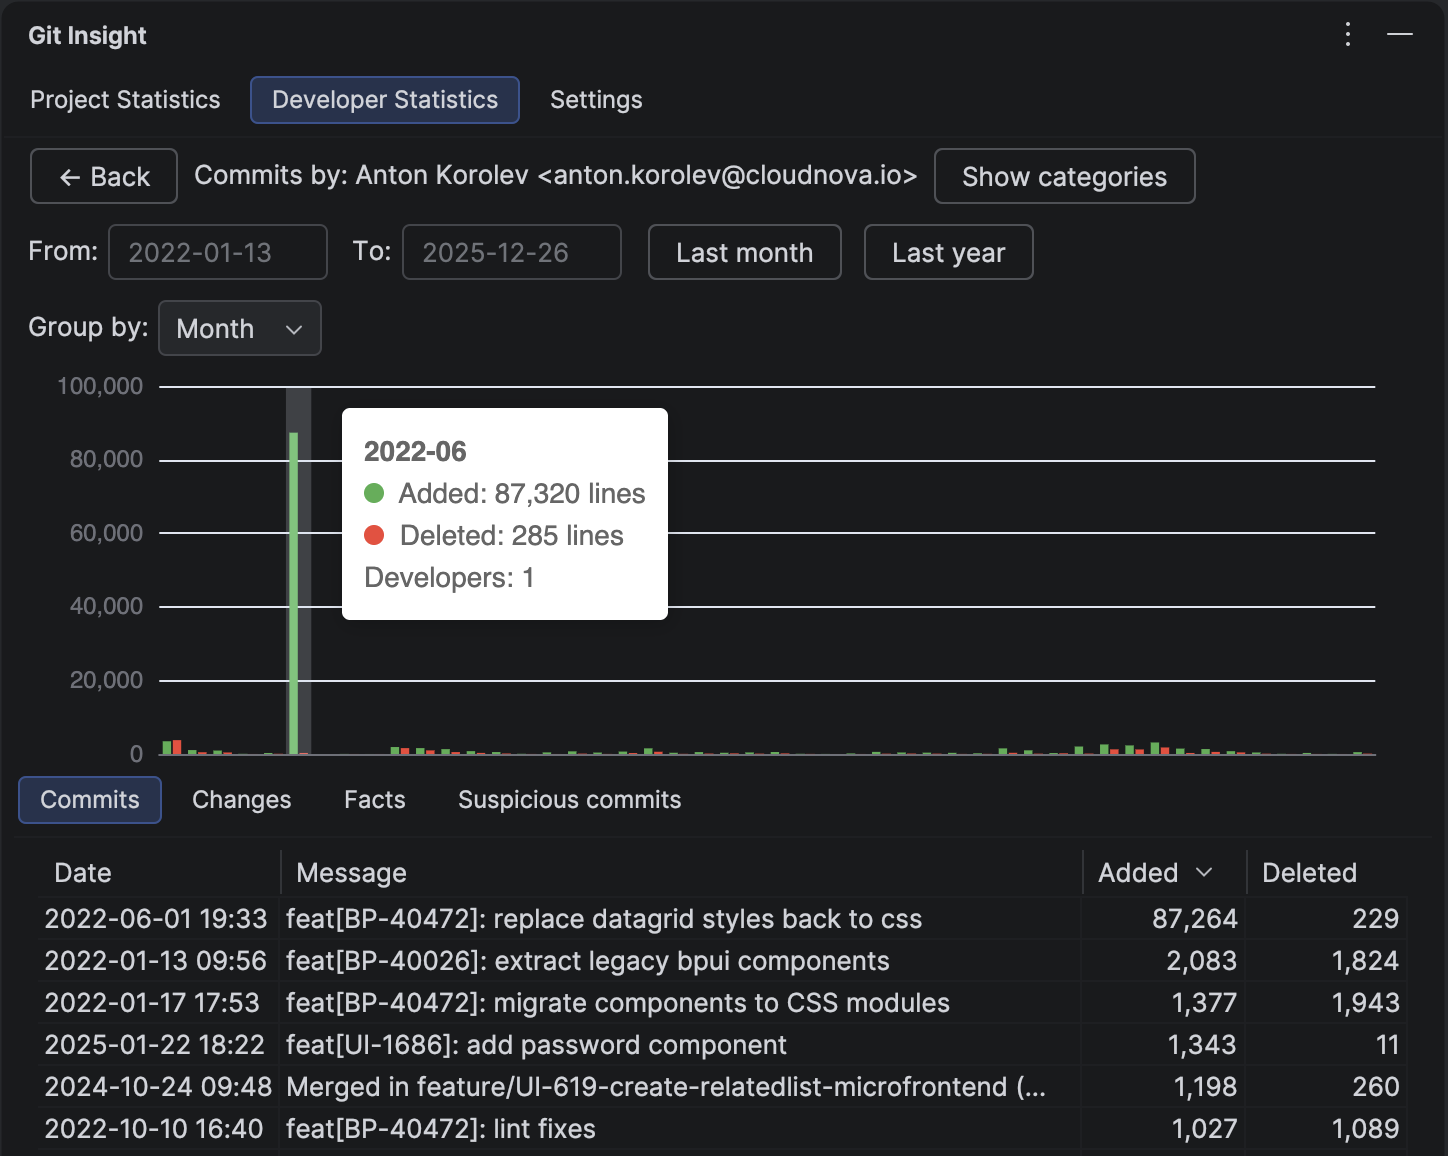
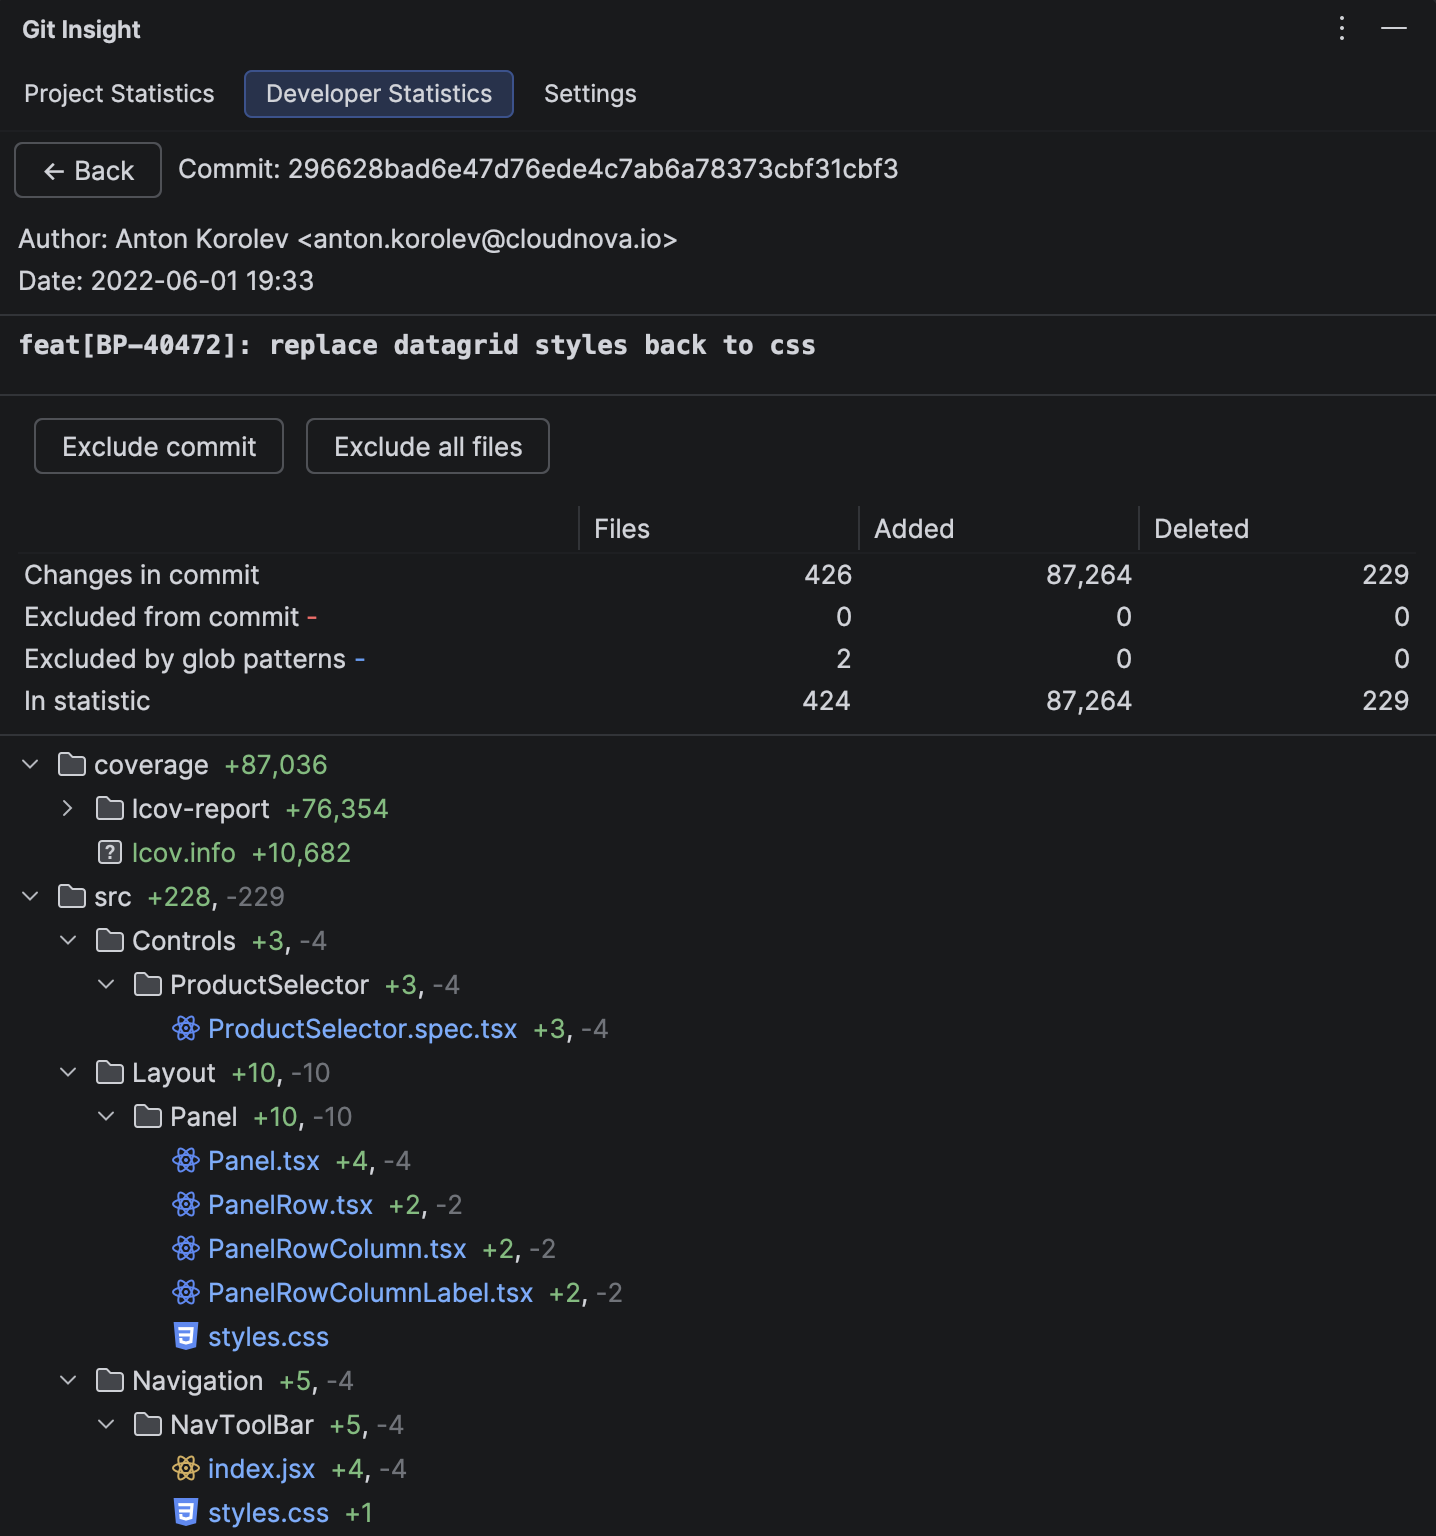
Investigate the Commit
Click the bar to open Commit Details. The breakdown shows that the coverage folder accounts for +87,036 of the 87,264 total lines, while the src folder has only +228/−229 — real code changes we want to keep.
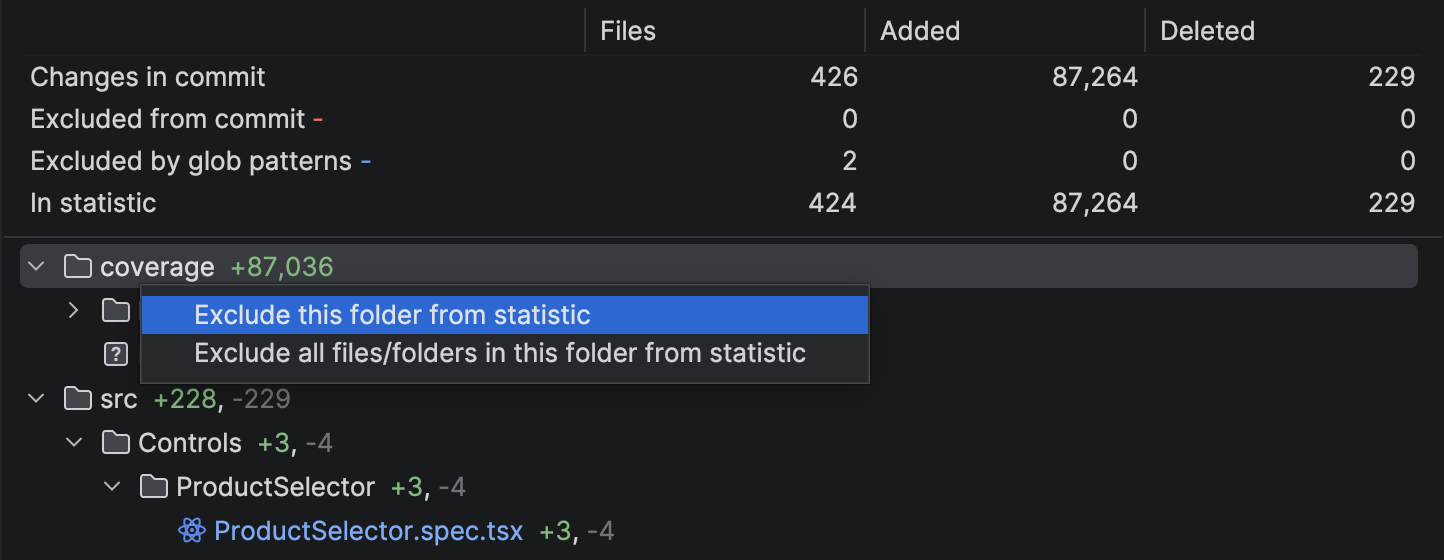
Right-click the coverage folder and select "Exclude this folder from statistic".
See the Result
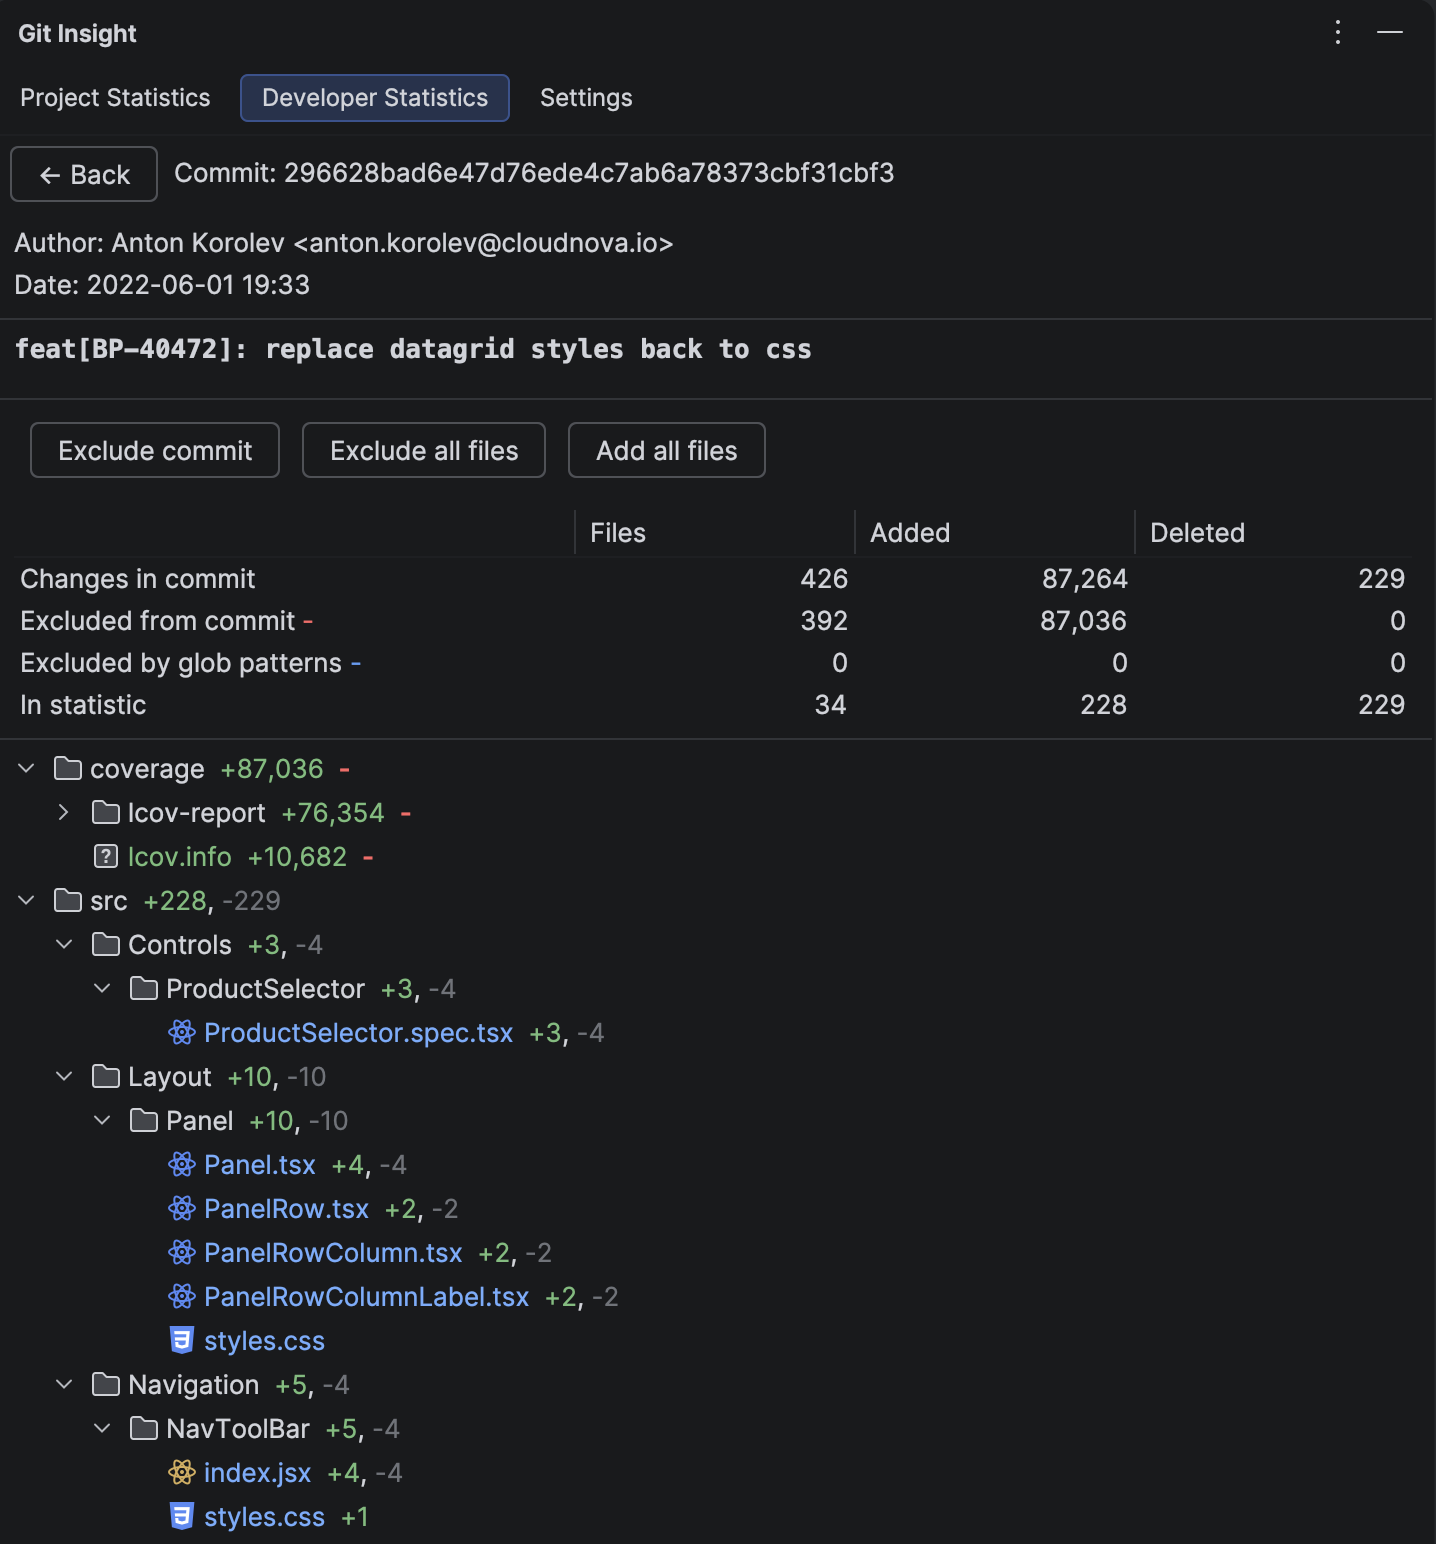
After exclusion, 392 files are removed from the commit, and only 34 remain (228 added, 229 deleted). The commit now reflects only the real code changes.
Back on the Developer Commits page, the anomalous spike is gone and the chart shows a realistic development pattern.
Tip
If you want to exclude a folder across all commits (not just one), use "Exclude all files/folders in this folder from statistic" instead. This creates a project-level glob pattern that applies automatically to every commit in the repository.
What's Next?
Now that your data is clean, explore what Git Insight can tell you about your project: