Project Facts
Get analytical metrics that go beyond raw numbers. Facts include velocity calculations, workday adjustments, and averages that help you understand development pace.
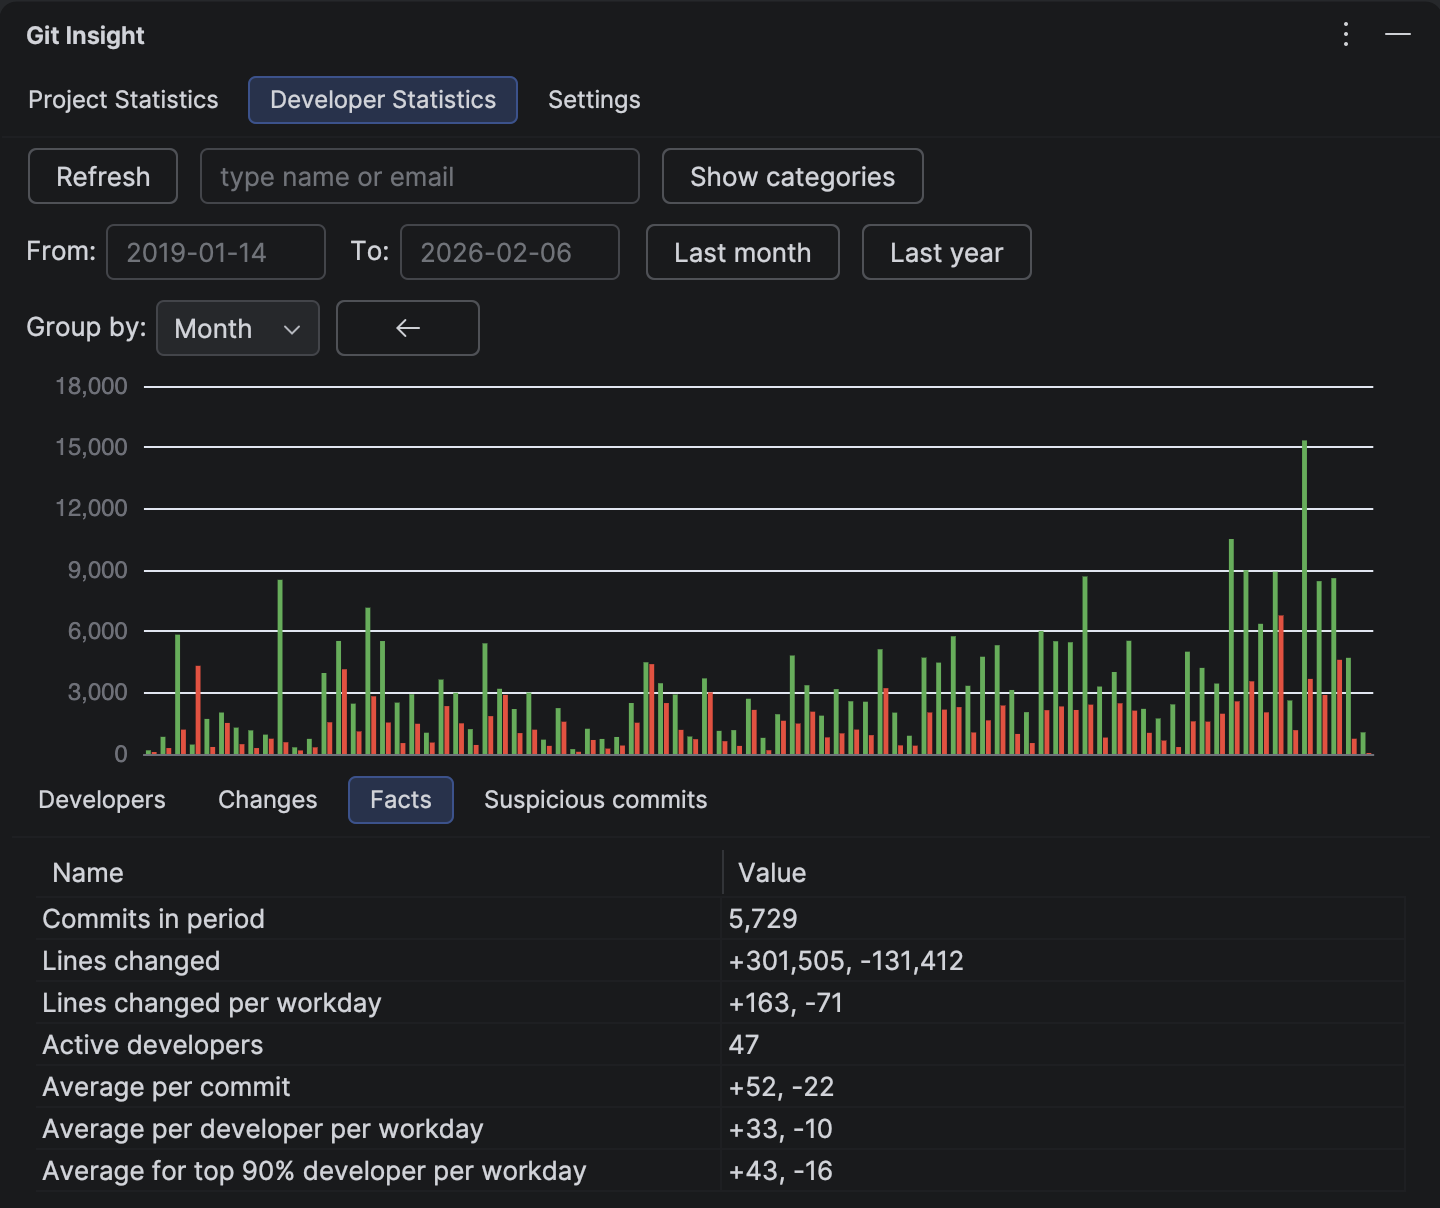
Key Features
- Commits count for the selected period
- Total lines changed with add/delete breakdown
- Per-workday velocity with vacation adjustment
- Per-developer averages excluding outliers
- Tooltips explaining each calculation
Available Metrics
Commits in period
Simple count of commits within the selected date range.
Lines changed
Total lines added and deleted, displayed as "+X, -Y" format.
Lines changed per workday
Project velocity metric. Calculated as total changes divided by working days in the period. Working days account for weekends (calendar days × 5/7) and include vacation adjustment (20 days/year prorated).
Active developers
Count of unique developers who contributed at least one line in the period.
Average per commit
Mean lines added and deleted per commit. Useful for understanding typical commit sizes.
Average per developer per workday
Each developer's personal velocity averaged across all contributors. Excludes single-commit developers to avoid skewing the average.
Average for top 90% developer per workday
Same as above, but excludes the bottom 10% of contributors by total lines. This filters out occasional contributors (DevOps editing Dockerfiles, one-off fixes from other teams, CI bots) to show the velocity of core team members.
How to Use
Compare Periods
Use date filters to compare metrics across different time periods. For example, compare Q1 vs Q2 velocity to track team growth or identify slowdowns.
Understand Tooltips
Hover over any metric row to see a detailed explanation of how it's calculated. This helps interpret the numbers correctly.
Individual vs Team
When viewing from Developer Commits, Facts shows metrics for that single developer. When viewing from Developer Statistics, Facts shows team-wide metrics.
Tip
The velocity metrics on this page are key for performance reviews. See how to use them effectively
Tip
The "top 90%" metric is particularly useful for large projects with many occasional contributors. It gives you a realistic picture of core team velocity without noise from infrequent commits.