Project Statistics
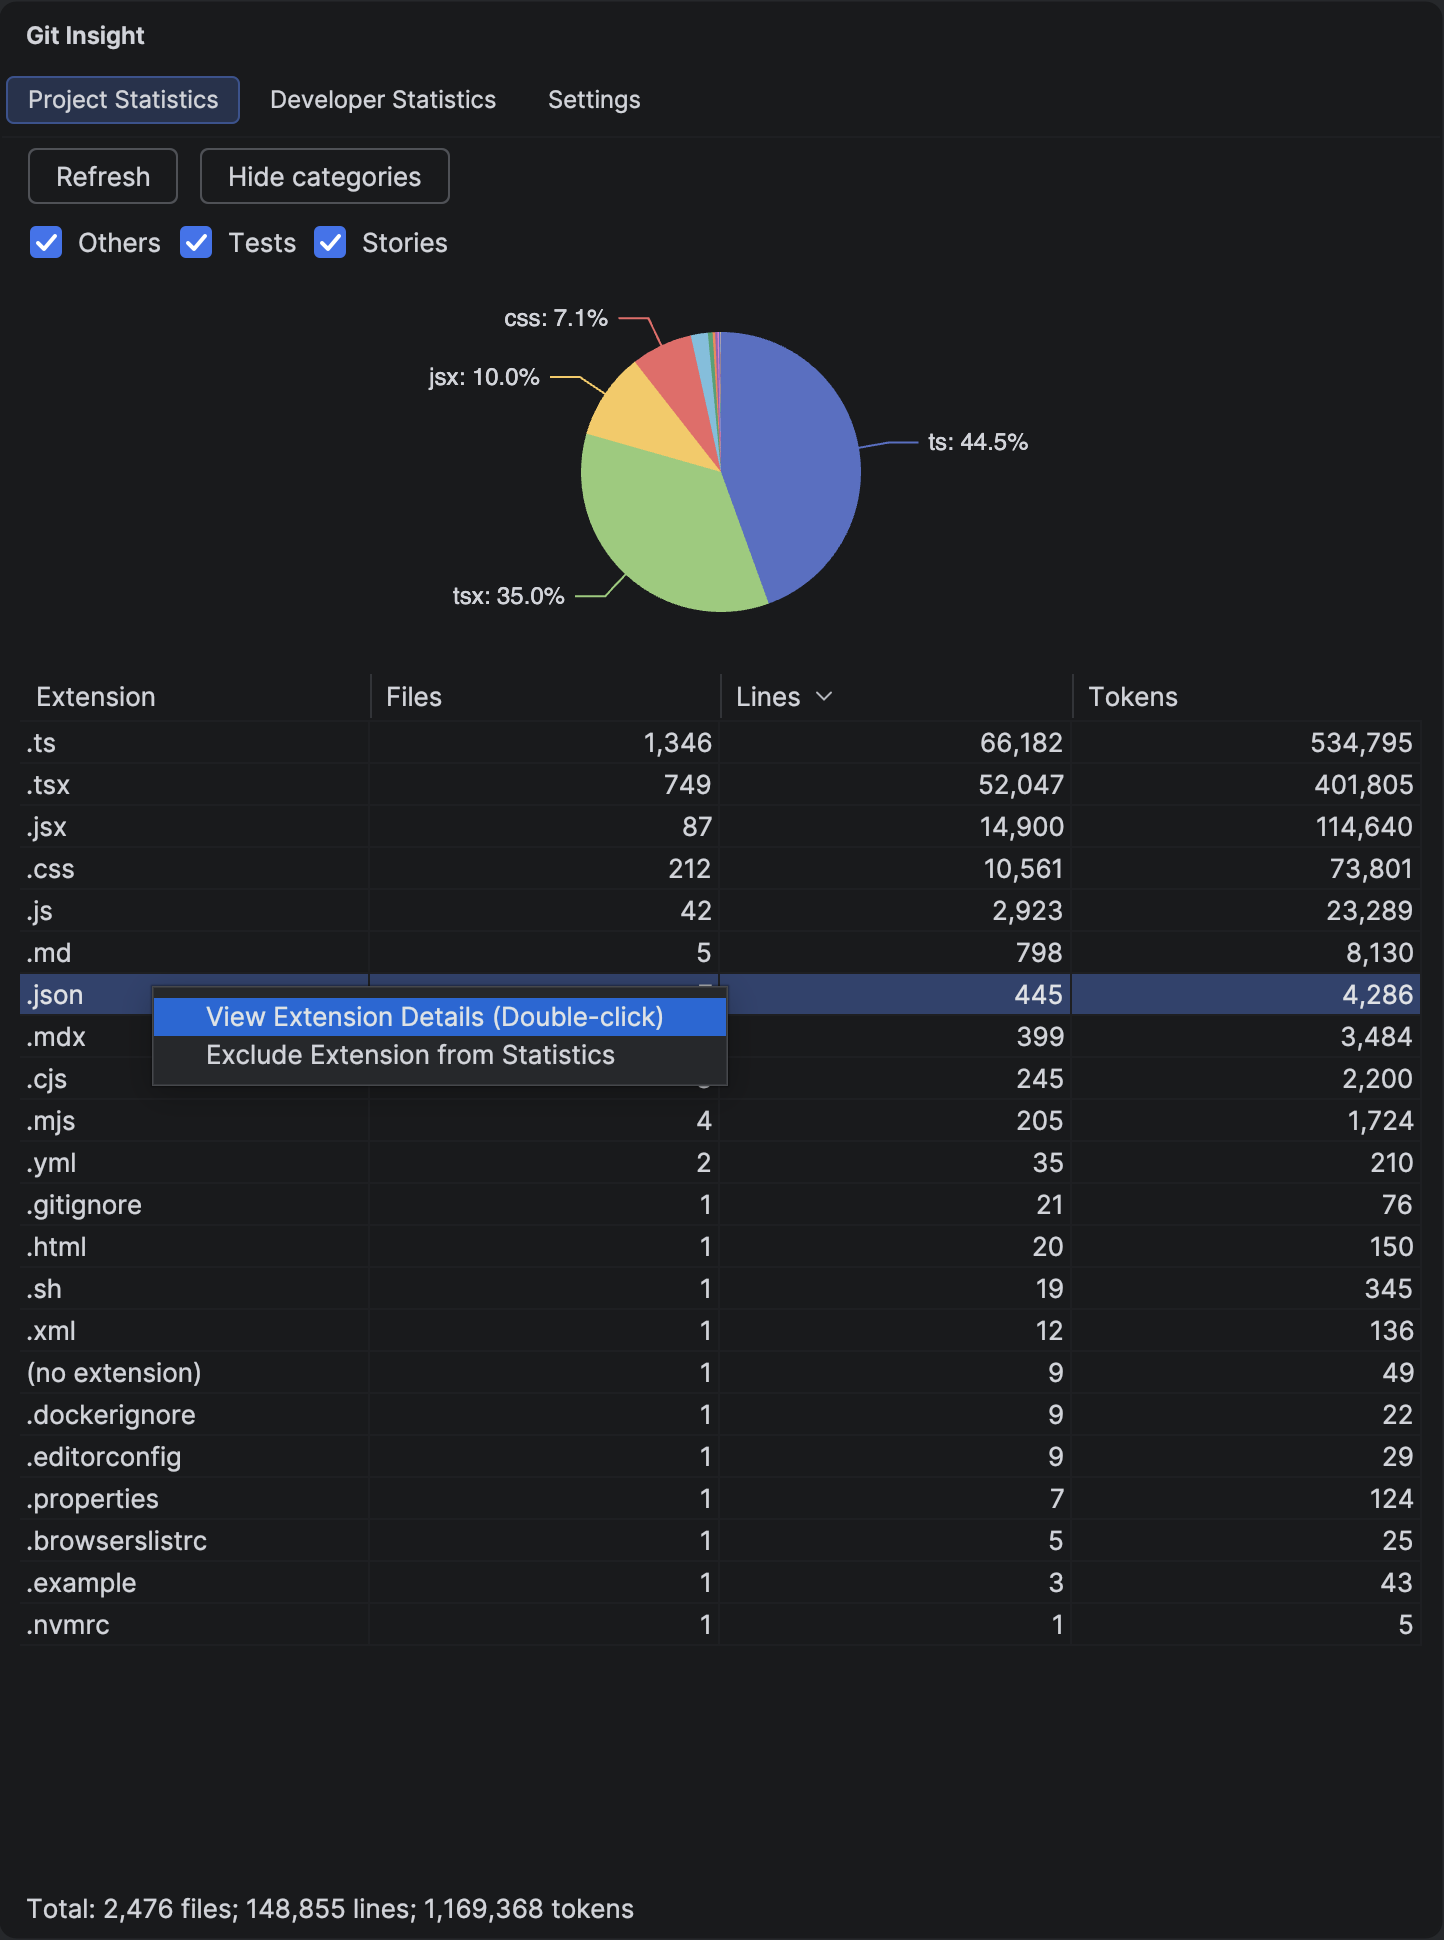
Get a quick overview of your entire codebase — see how many files, lines, and tokens exist for each file extension.
Key Features
- File count, line count, and token count grouped by extension
- Interactive pie chart showing line distribution
- Sortable columns — click any header to sort
- Category filtering to focus on specific file types
- Respects .gitignore and custom exclusion patterns
Understanding the Data
Columns
- Extension — file extension (e.g., .kt, .java, .ts)
- Files — number of files with this extension
- Lines — total non-empty lines of code
- Tokens — LLM-style token count, useful for estimating AI context usage
Pie Chart
The pie chart visualizes line distribution across extensions. Extensions contributing less than 2% are grouped together for readability. Hover over segments to see exact percentages.
How to Use
Drill Down to Files
Double-click any row to see individual files with that extension. This opens the Extension Details view where you can inspect specific files and add exclusions.
Filter by Category
Click the "Show categories" toggle to reveal category checkboxes. Categories are defined in Settings using glob patterns. For example, create a "Tests" category with patterns like **/*Test.kt and **/*.spec.ts.
Exclude Extensions
Right-click any row and select "Exclude Extension from Statistics" to add a pattern that excludes all files with that extension.
Tip
Tracking a JS-to-TS or Java-to-Kotlin migration? See our guide: Track Your Code Migration Progress
Tip
Token counts help you understand how much of your codebase fits into an LLM's context window. A typical large language model handles 100K-200K tokens — compare this to your project's total.