Measure How AI Tools Affect Your Development
Your team adopted Copilot, Cursor, or Claude Code. But is product development actually faster — or are the numbers inflated by AI-generated tests?
The Problem
Your company invested in AI coding assistants. Leadership wants to know: was it worth it? You pull up git statistics and see a 40% increase in lines of code. Impressive — until you realize most of it is tests.
AI tools are exceptionally good at generating tests. That's valuable, but tests are invisible to your users. They don't ship features, fix bugs, or deliver product value. When you report "40% more code" to stakeholders, you're mixing two very different things:
- Product code — features, bug fixes, infrastructure improvements that users benefit from
- Test code — quality assurance that AI generates with particular enthusiasm and in unlimited volumes
To honestly assess whether AI tools accelerated your product development, you need to separate these and compare the right numbers.
The Workflow
First: Prepare Your Repository
Before measuring AI impact, make sure your repository is prepared — irrelevant files excluded, suspicious commits handled, developer identities merged. This ensures the data you're comparing is clean.
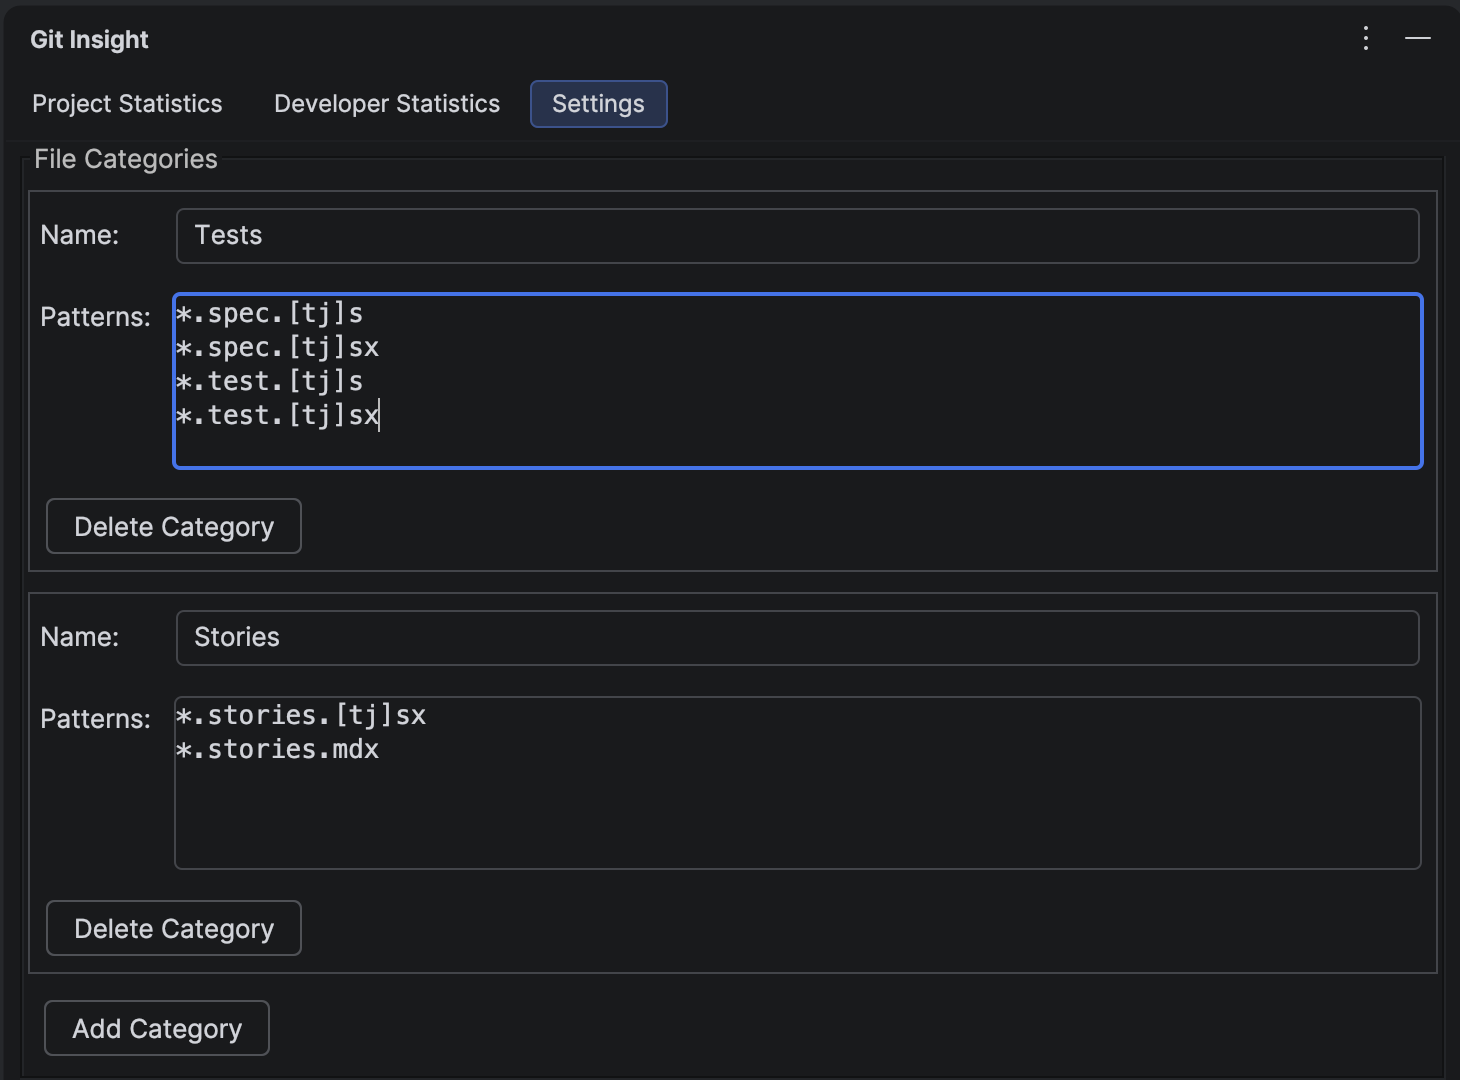
1 Create a "Tests" Category
Open the Settings tab in Git Insight. Create a category called "Tests" with patterns matching your test files. For example:
**/*Test.kt,**/*Test.java— JVM test classes**/*.spec.ts,**/*.test.ts— JavaScript/TypeScript tests**/test/**,**/tests/**— test directories**/__tests__/**— Jest convention
This creates a filter that separates test code from everything else. When viewing statistics, you'll see checkboxes for "Tests" and "Others" (all non-test code).
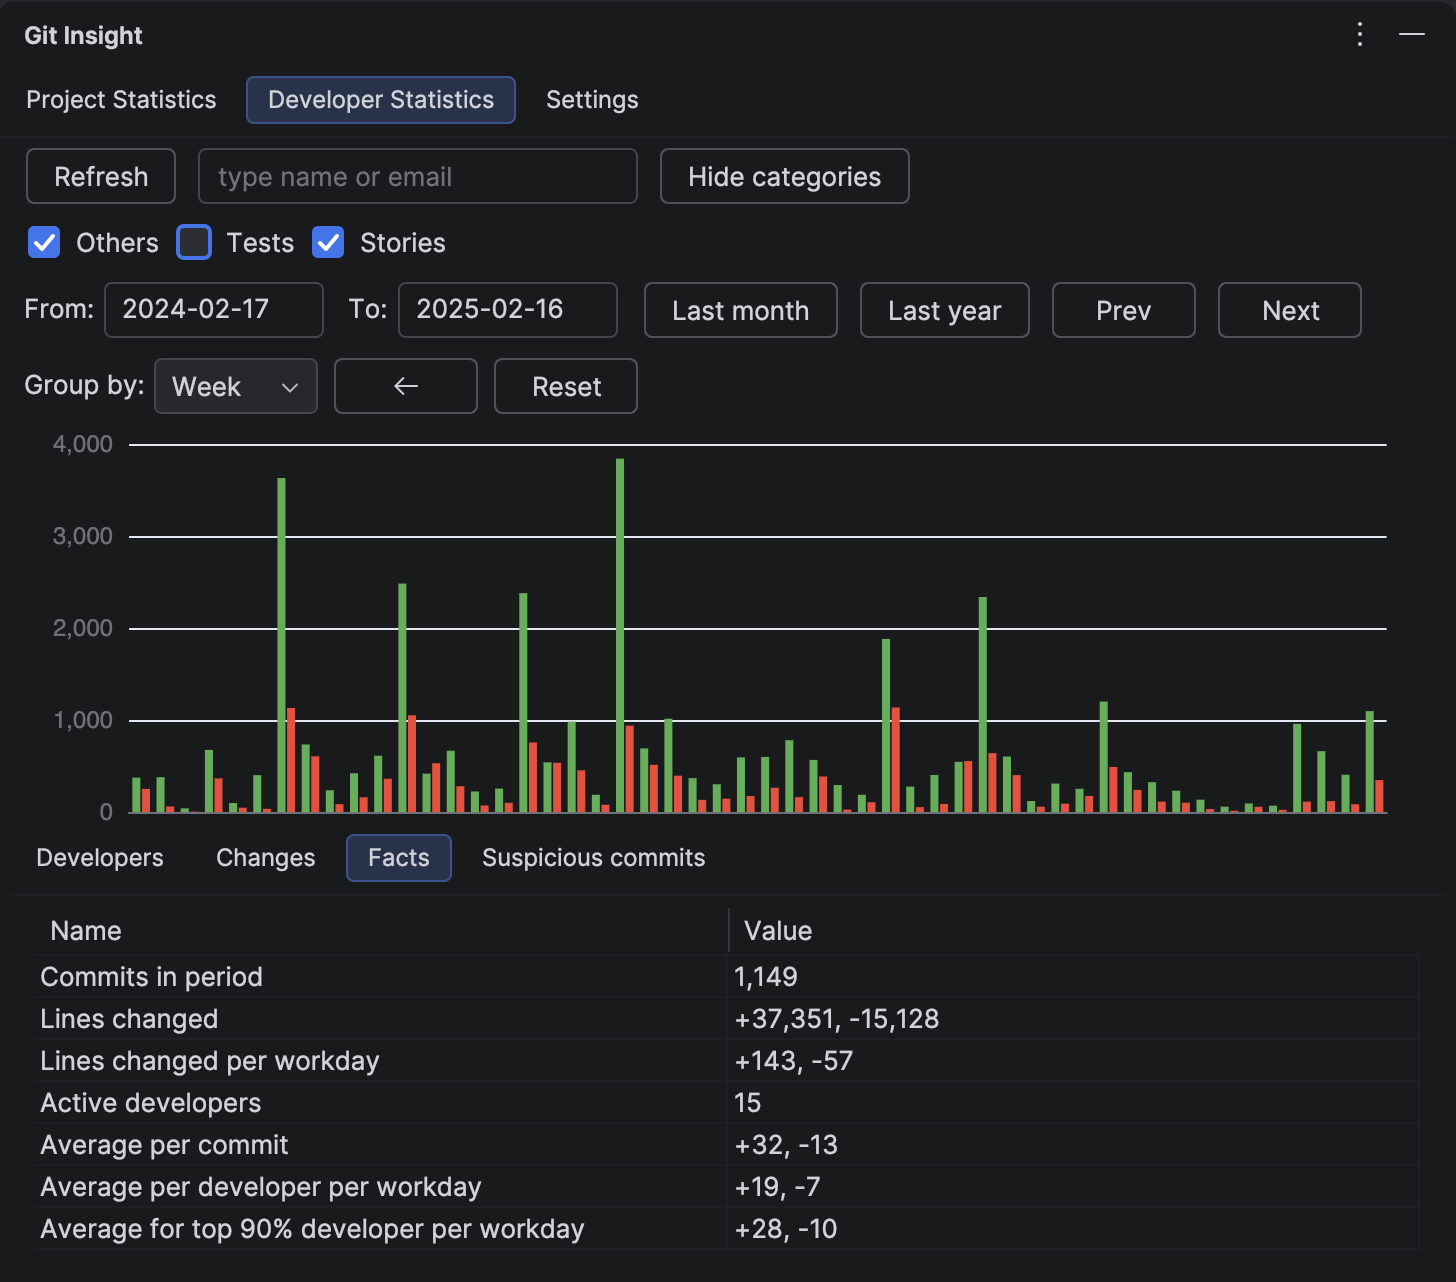
2 Measure the "Before" Period
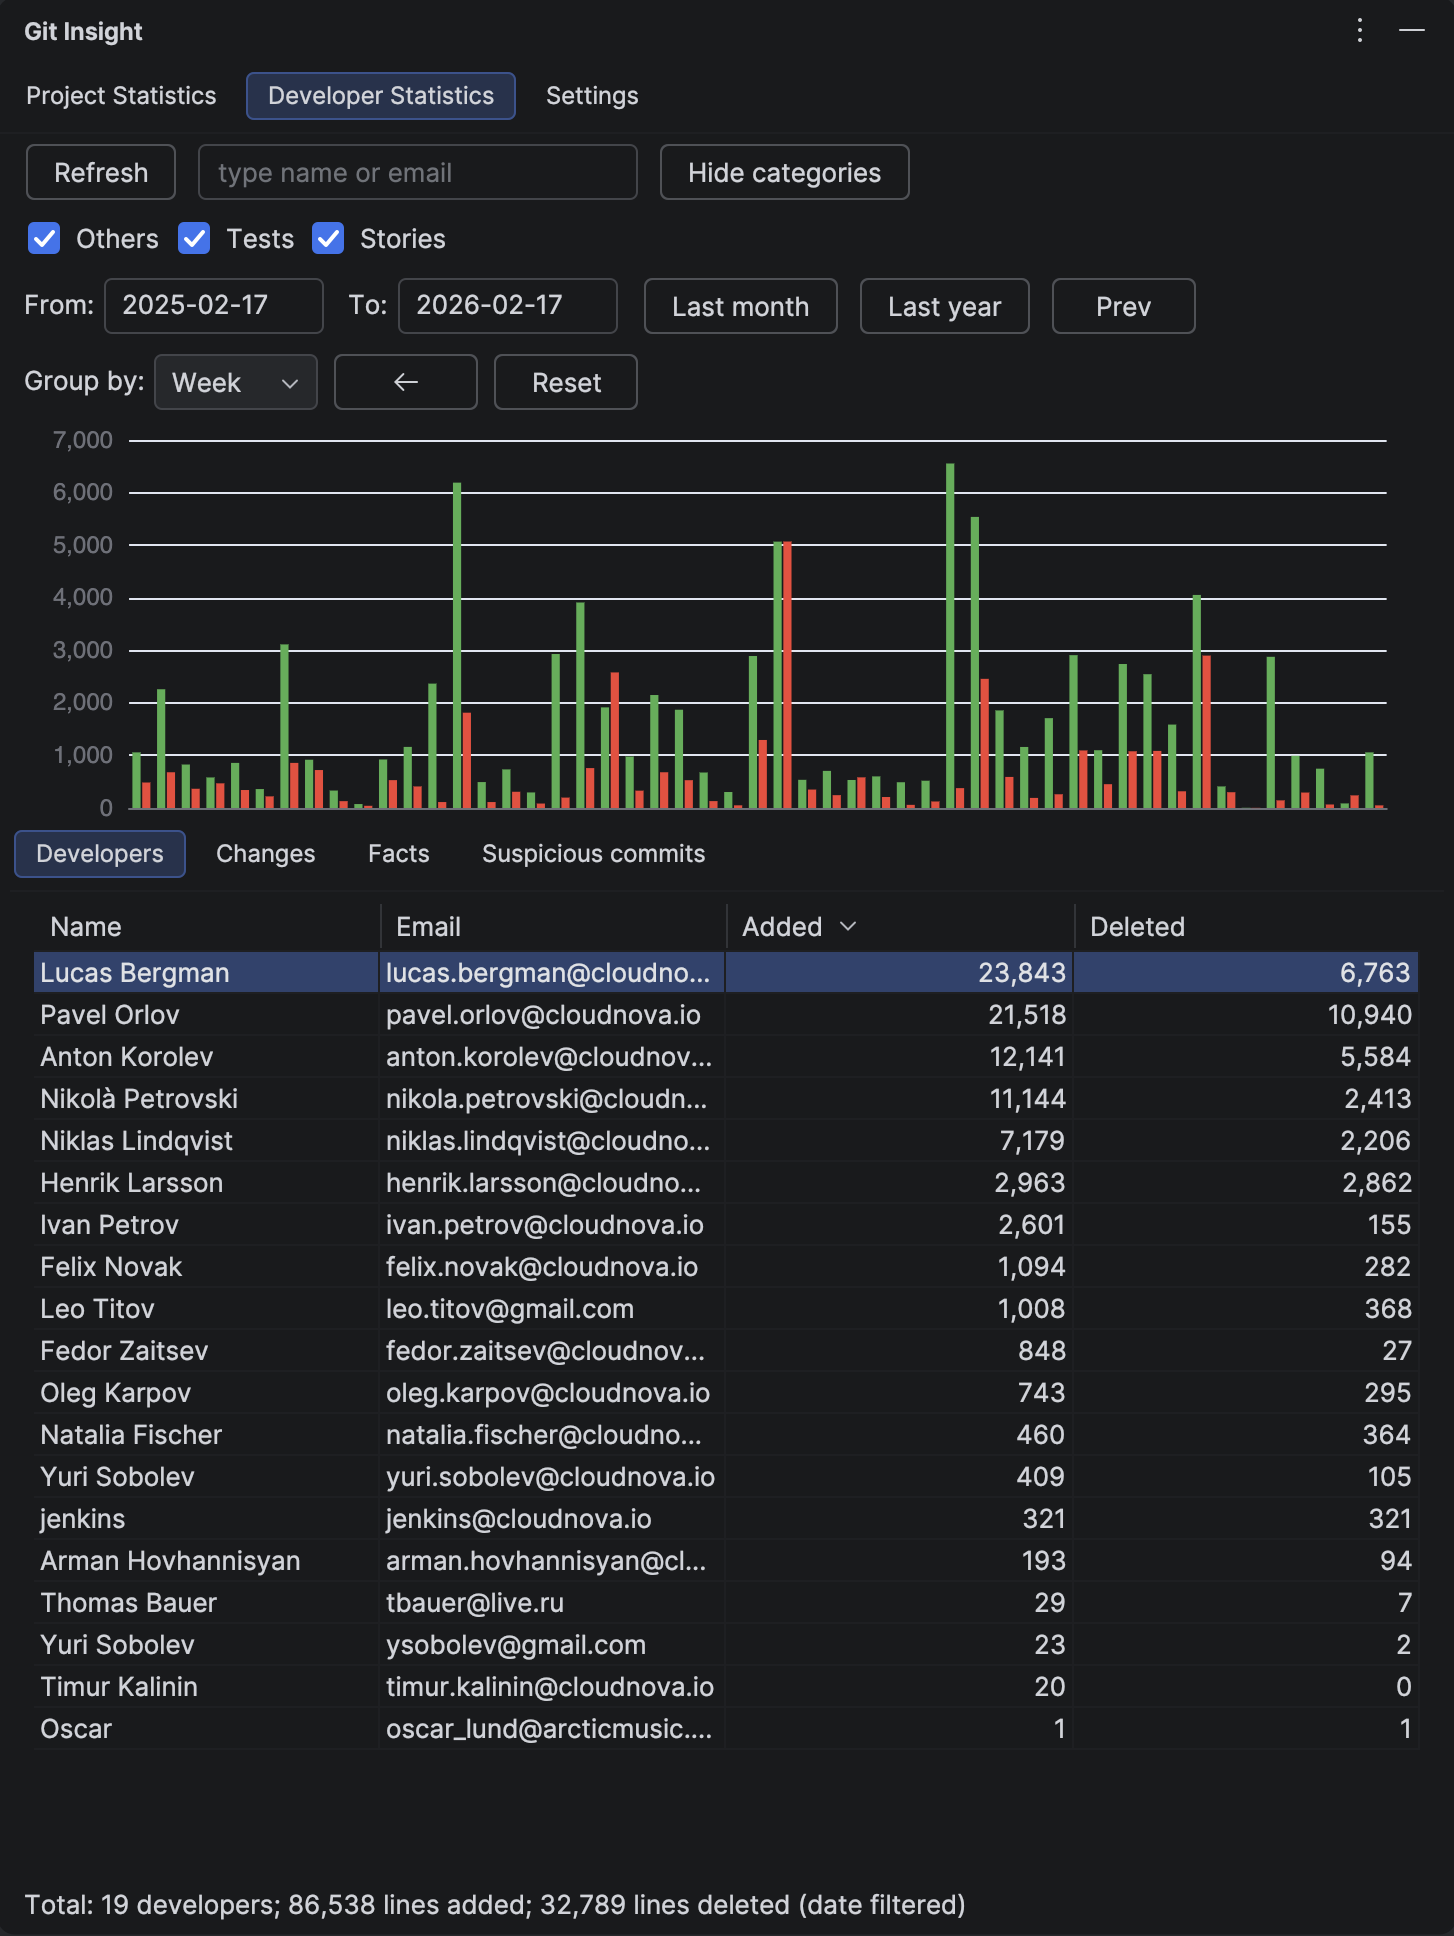
Open the Developer Statistics tab. Set the date range to a period before your team adopted AI tools — for example, the 6 months before the rollout.
Uncheck the "Tests" category to see only product code. Note the key metrics:
- Total lines changed (product code only)
- Lines changed per workday on the Facts tab
- Contribution chart shape — the baseline velocity
This is your baseline: how fast your team shipped product code without AI assistance.
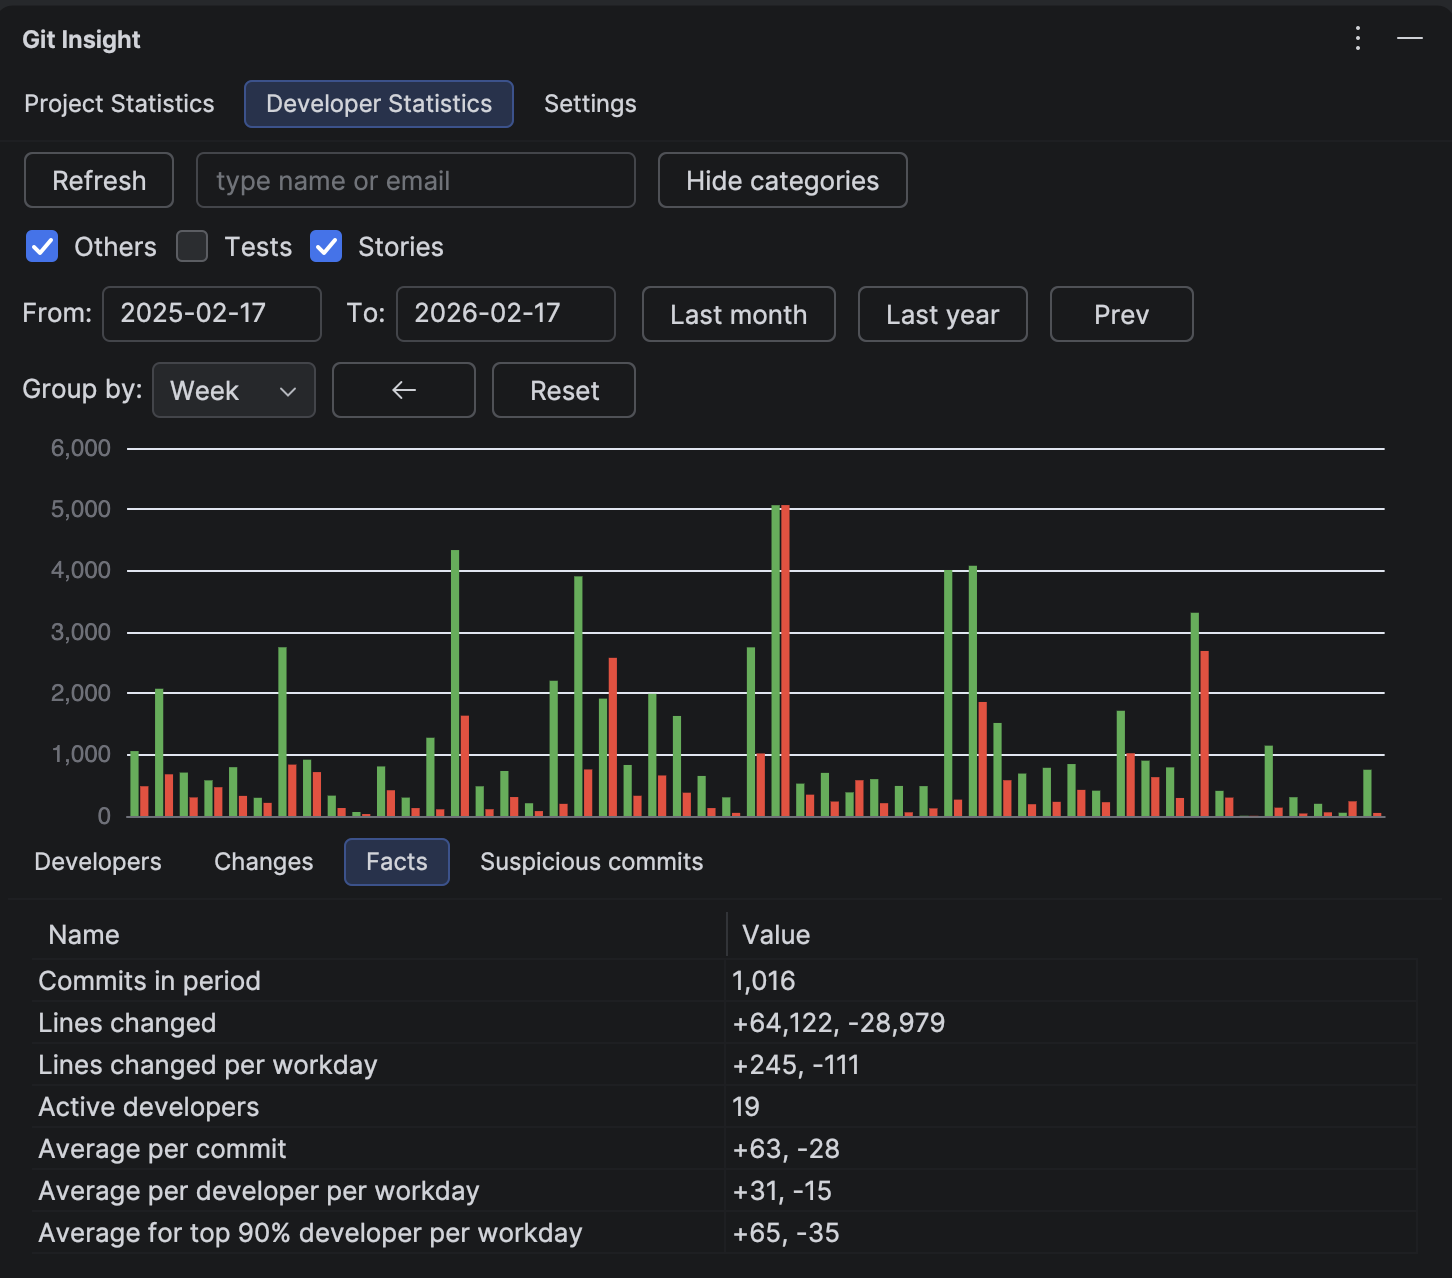
3 Measure the "After" Period
Click the Next button to shift to the same-length period after AI adoption. Keep the "Tests" category unchecked — you're still looking at product code only.
Now compare:
- Did product code velocity increase? If yes, AI is genuinely accelerating feature delivery
- Did it stay flat? AI might be helping with tests but not with core development
- Did it decrease? Developers may be spending time learning new tools, or AI-generated code requires more review effort
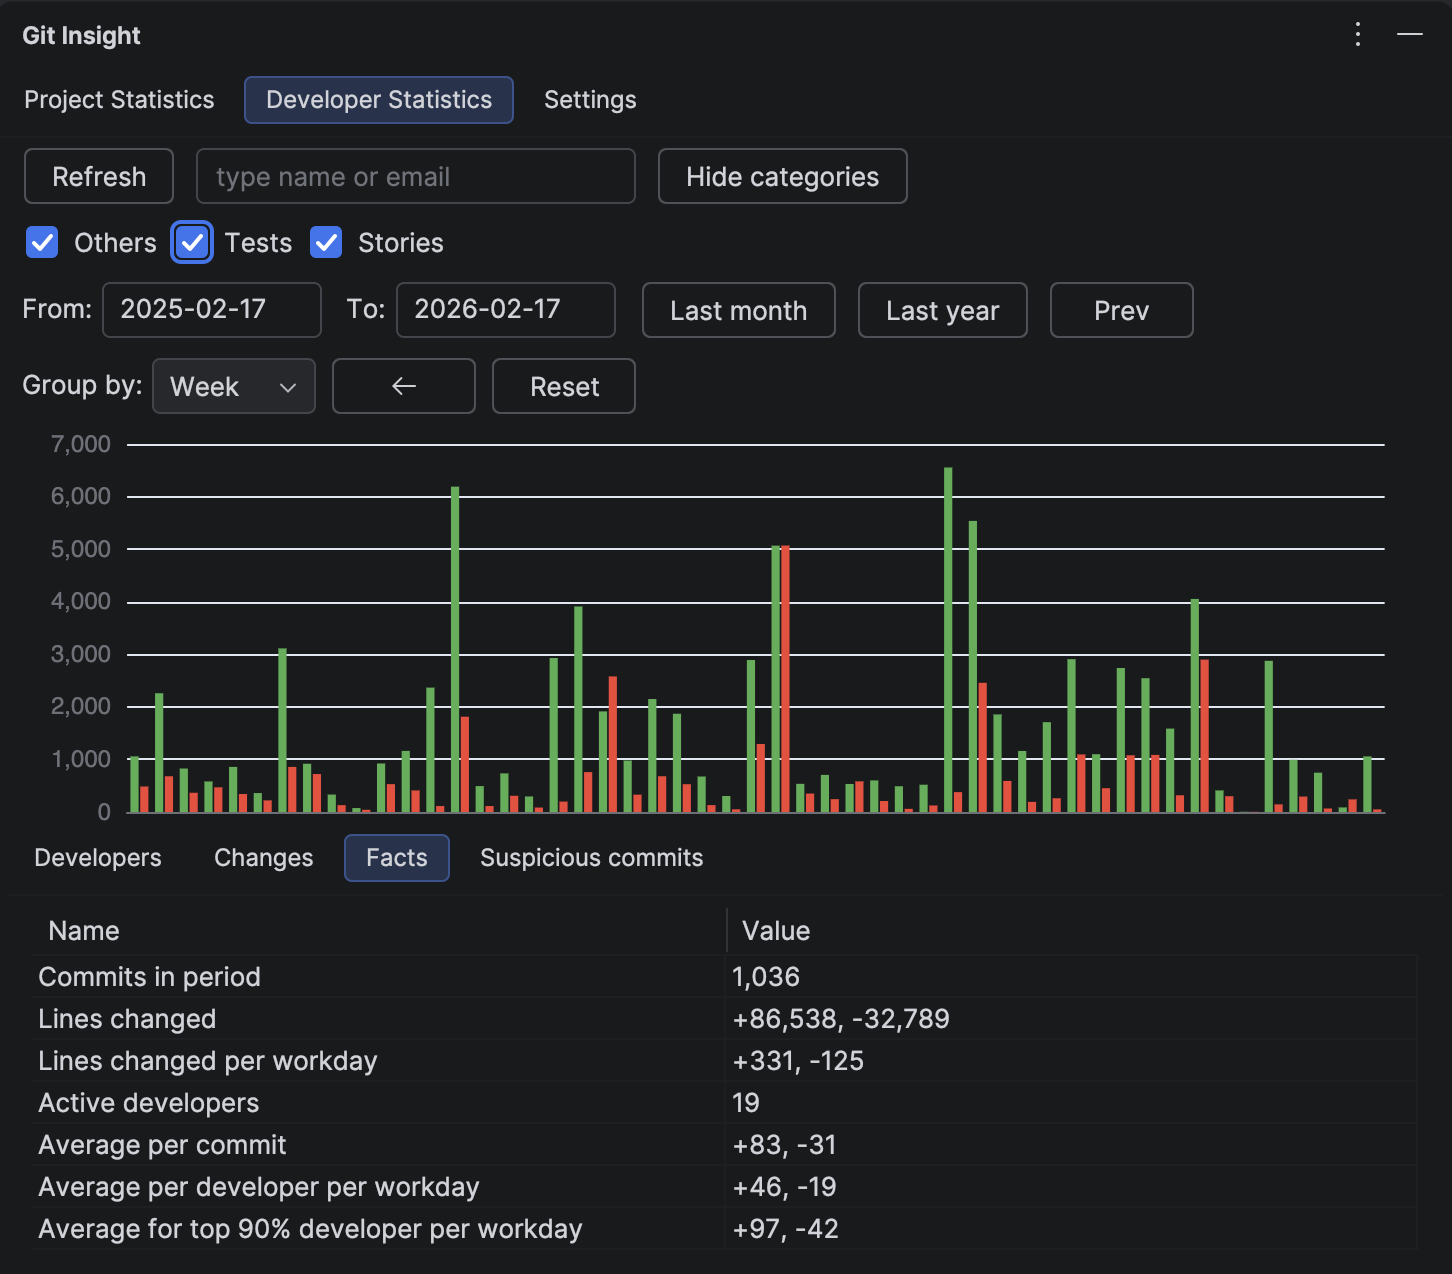
4 Check the Full Picture
Now re-enable the "Tests" checkbox to see total output (product + tests). Compare the same before/after periods. You'll likely see a bigger jump in total numbers — that's the AI-generated test volume.
This gives you a complete story for leadership:
- "Total code output increased by X%"
- "Product code velocity changed by Y%"
- "Test coverage increased by Z% — AI is generating tests we didn't have before"
An honest report separates these numbers instead of conflating them.
5 Drill Into Individual Contributors
Some developers adopt AI tools faster than others. Use the Developer Statistics table (with the "Tests" filter) to see who increased their product code output and who's primarily generating tests.
This isn't about ranking — it helps you identify:
- Power users who found effective workflows and can share practices with the team
- Developers who need support in integrating AI tools into their specific domain
- Areas of the codebase where AI is most vs. least effective (via the Changes tab)
What the Numbers Usually Show
Based on common patterns we see in development teams:
- Test volume jumps significantly — AI is very good at writing tests, and developers generate them more freely when it's easy
- Product code velocity has a modest increase — the real gain is often in code quality and fewer bugs, not raw output
- The impact varies by domain — CRUD features benefit more from AI than complex algorithmic or infrastructure work
- The "ramp-up" period is real — the first 1-2 months may show flat or decreased velocity as developers learn new tools
Bonus: Is Your Codebase AI-Friendly?
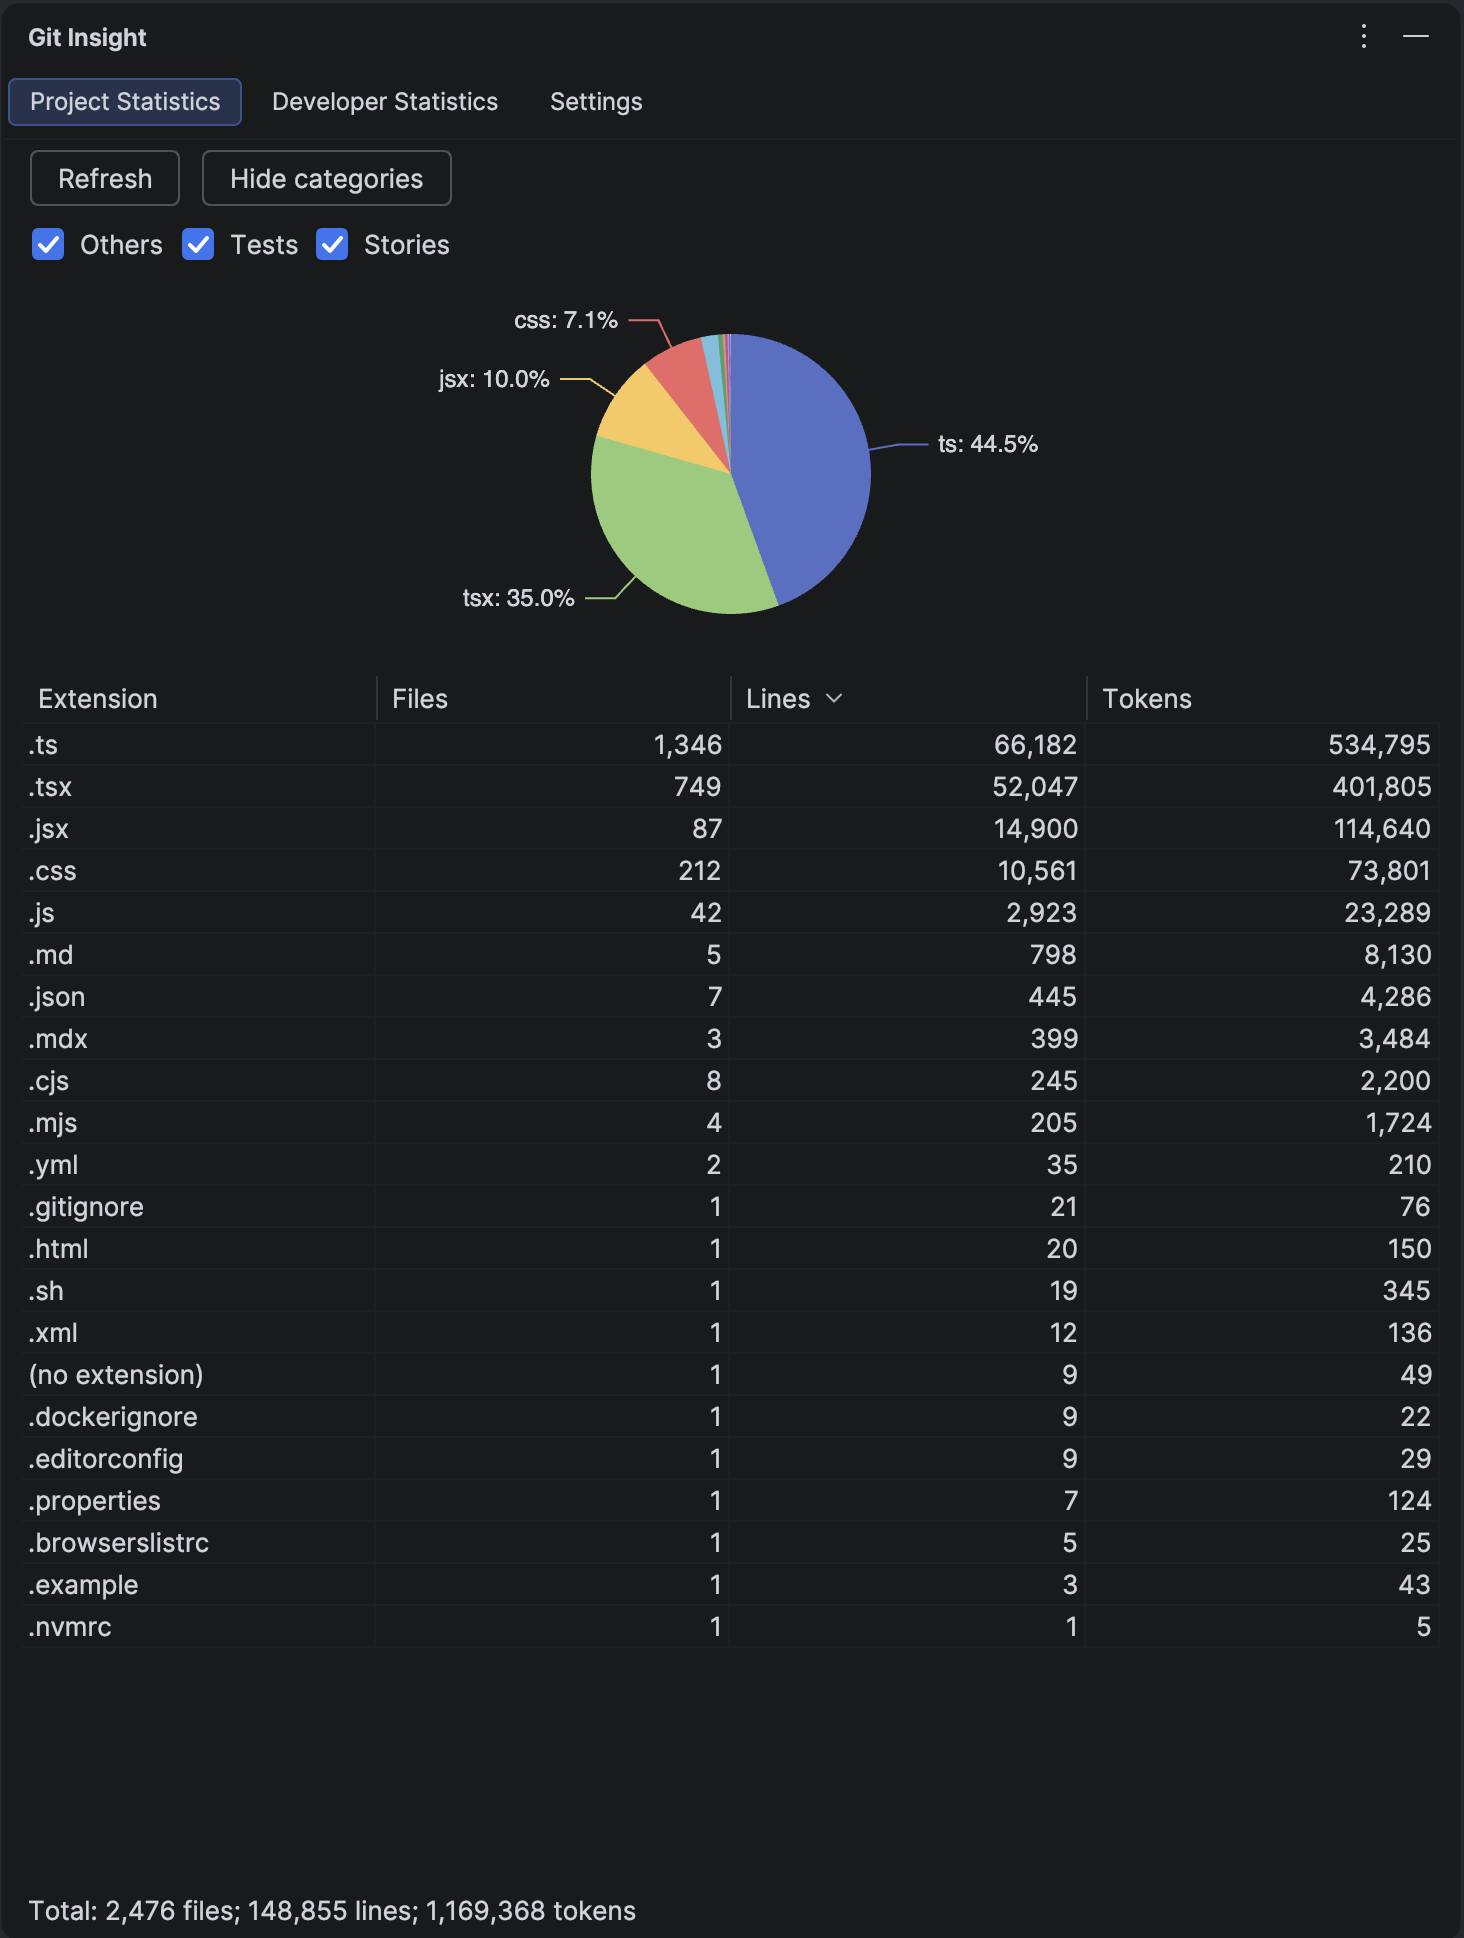
The Project Statistics tab shows your codebase size in tokens — the unit AI models use to process text. This tells you how much of your project fits within an LLM's context window.
A project under 100K tokens can be processed almost entirely by modern LLMs. A project with 500K+ tokens means AI tools can only "see" a fraction at a time, which may limit their effectiveness for cross-cutting changes.
If AI impact is lower than expected, codebase size in tokens may be a contributing factor.
Measure AI Impact on Your Team
Install the free trial, create a "Tests" category, and see the real numbers in minutes.
Install Free Trial