Git Analytics for Performance Reviews
Stop guessing about team performance. Get data-driven insights into developer contributions in minutes, not hours.
The Problem
Performance review season arrives and you need concrete data about your team's contributions. Your current options:
- Rely on intuition and Jira tickets — subjective, incomplete, doesn't capture actual code work
- Manually dig through git log — takes hours per developer, produces raw numbers without context
- Ask developers to self-report — biased, inconsistent, time-consuming for everyone
Even when you gather the data, raw line counts are misleading. A formatting commit adds 50,000 lines. Auto-generated code inflates numbers. One developer's 10 lines in the build system are worth more than another's 100 lines on a form. You need context, not just numbers.
The Workflow
Here's how to prepare a data-backed performance review with Git Insight in about 10 minutes per developer.
Prerequisite: Prepare Your Repository
Before analyzing performance data, make sure your repository is prepared — file exclusions configured, suspicious commits handled, and developer identities merged. This is a one-time setup that ensures all your analytics are accurate.
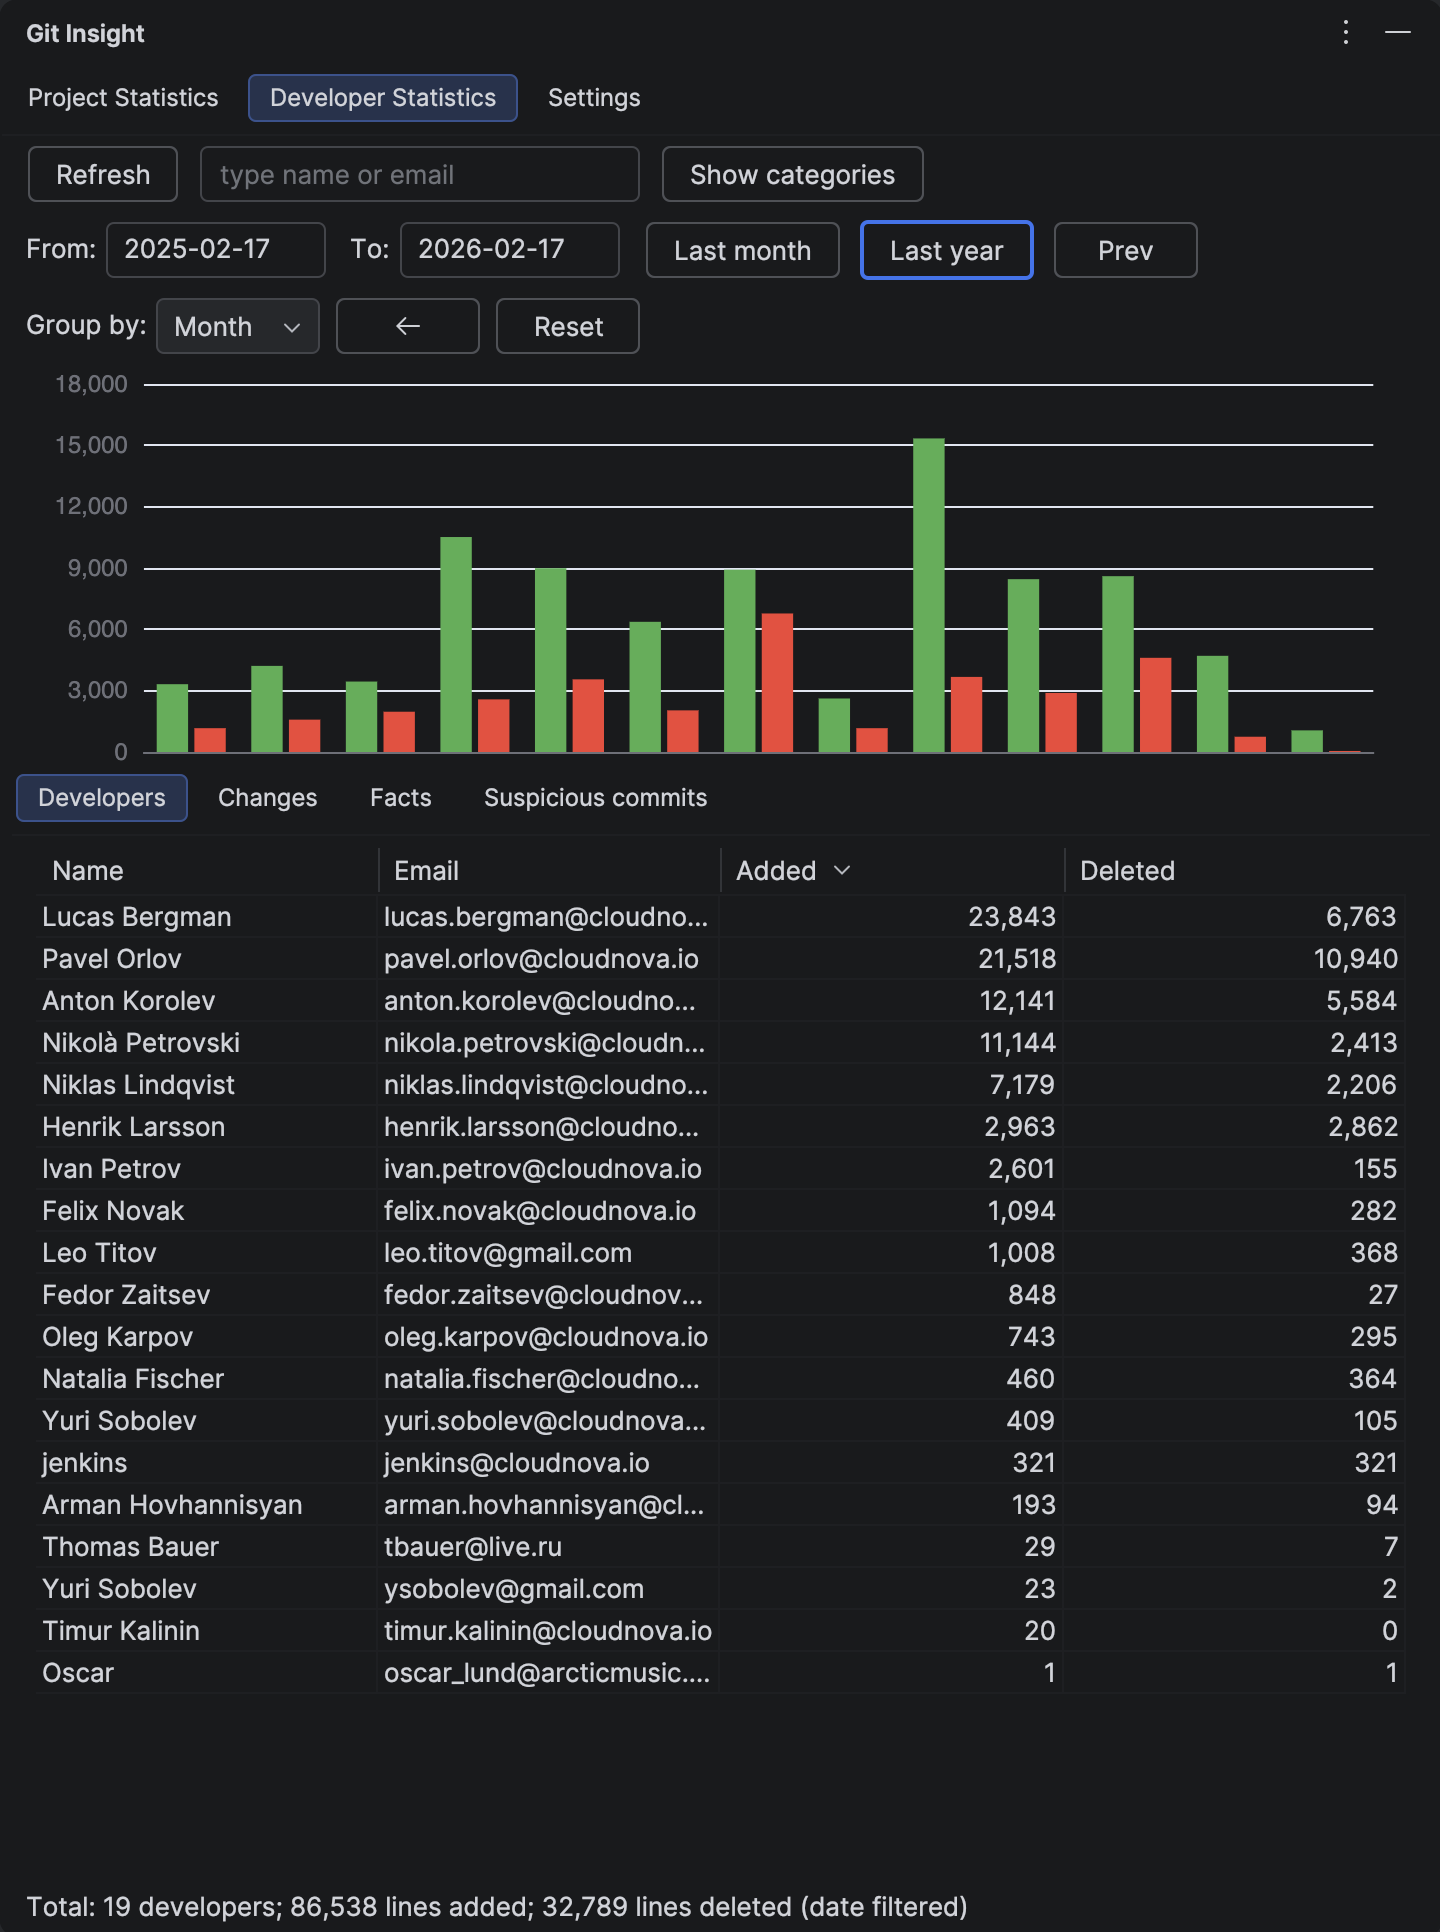
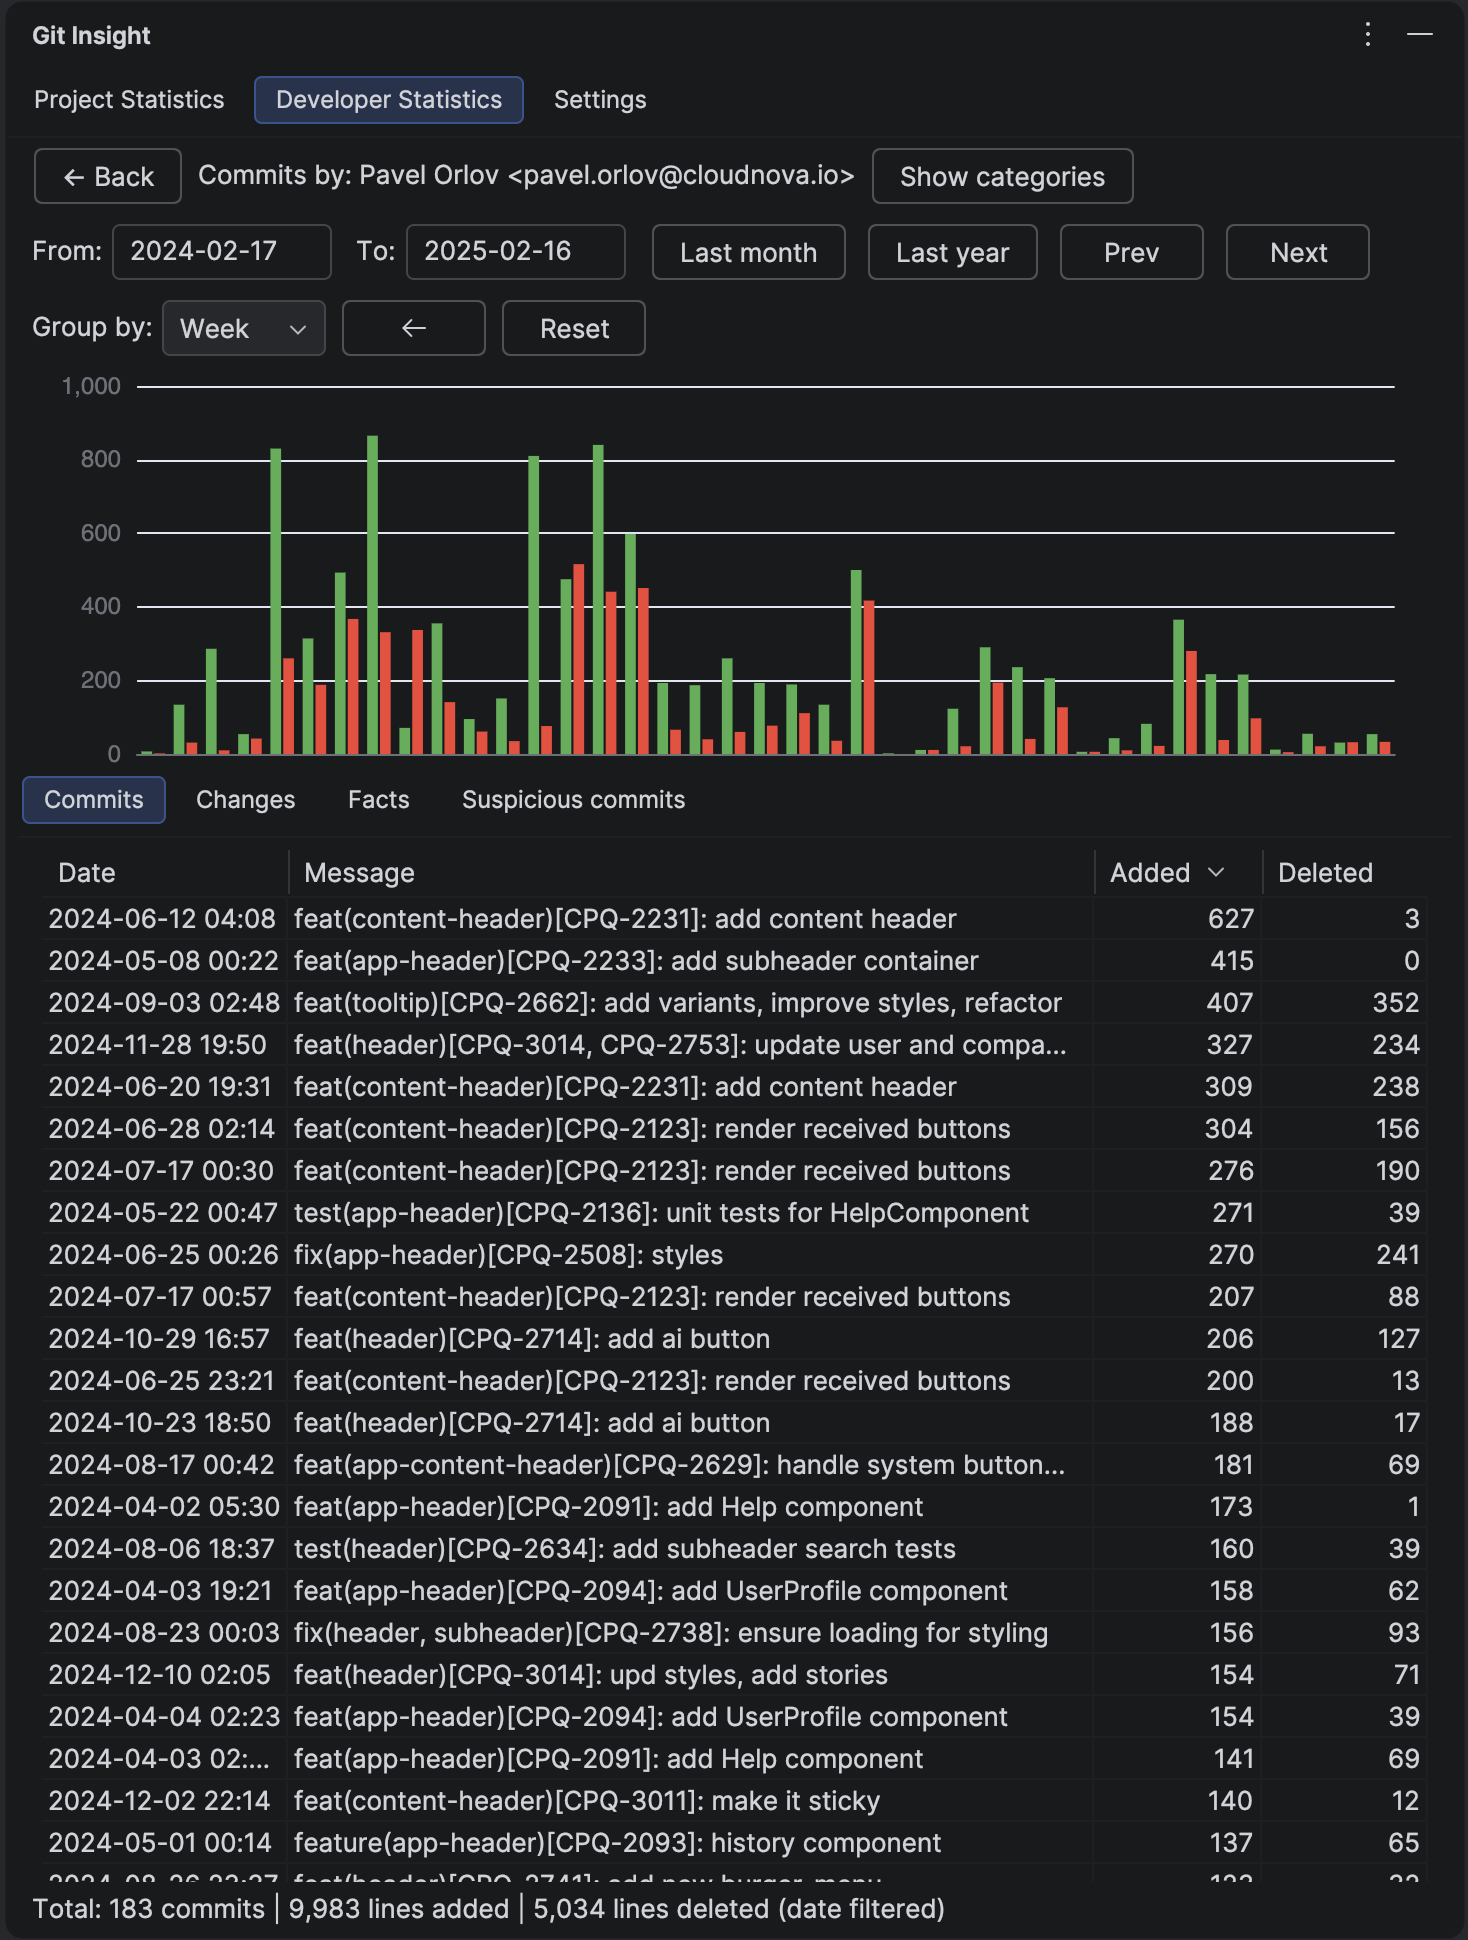
1 Set the Review Period
Open the Developer Statistics tab and set the date range — for example, the last 6 months or the last year. Use the "Last year" quick button or enter custom dates. We recommend periods of 6+ months to reduce noise from vacations, unmerged feature branches, and seasonal variation.
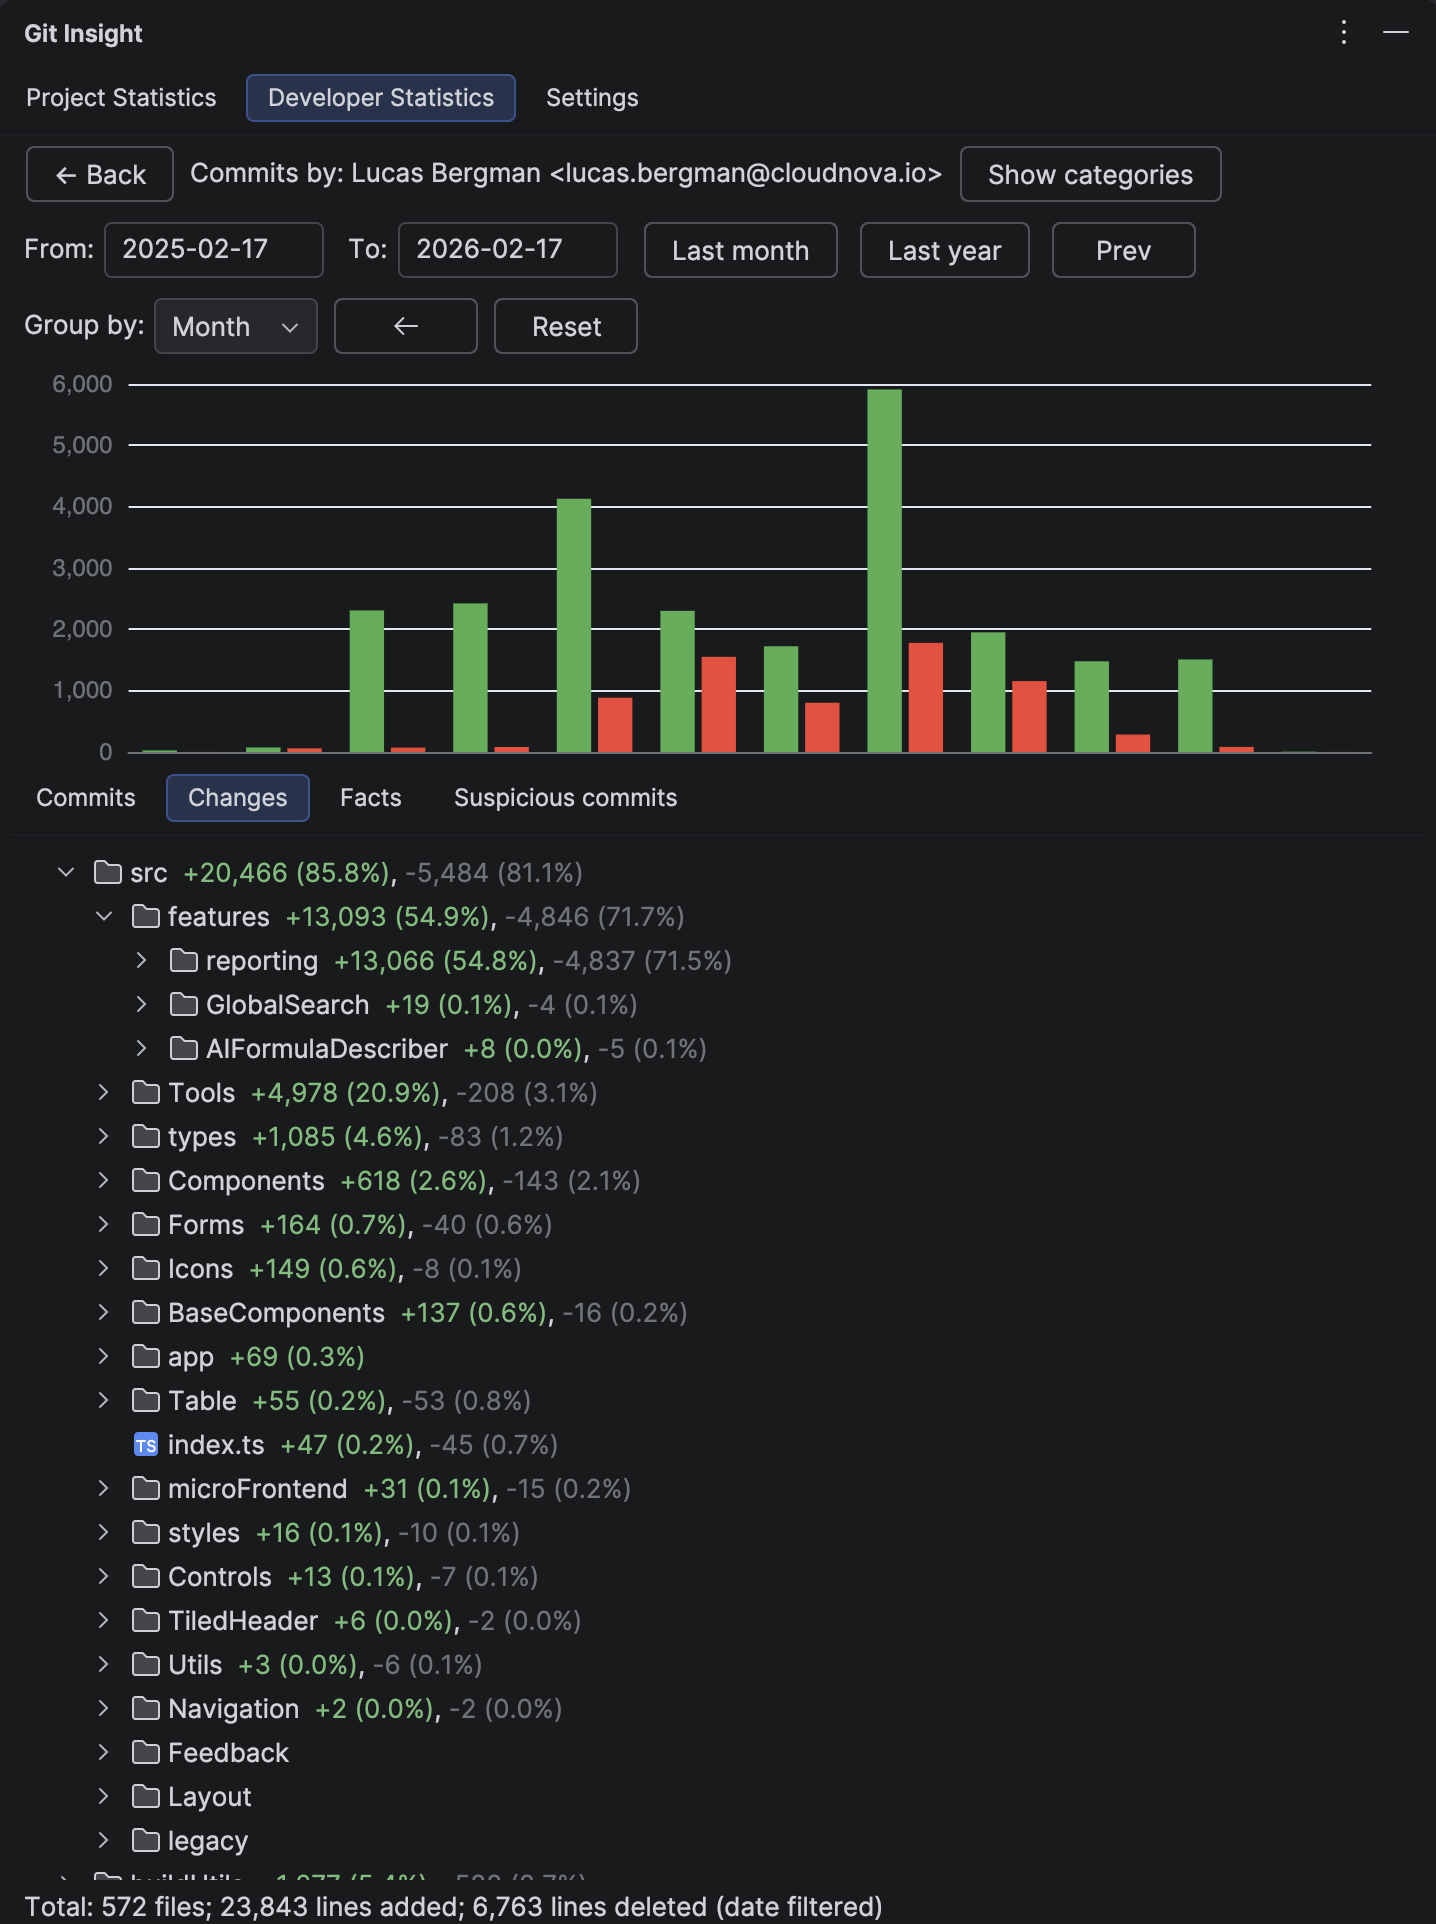
2 Analyze Contribution Areas (Not Just Line Counts)
The Changes tab is the most valuable view for performance reviews. It shows where in the codebase each developer focused their work — which directories, which subsystems, which types of files.
This tells you more than raw numbers:
- 10 lines in the build system or caching layer require deep understanding of the system
- 100 lines adding form fields is straightforward feature work
- A developer working across many directories is likely handling cross-cutting concerns
- Concentrated work in one area suggests deep ownership of that subsystem
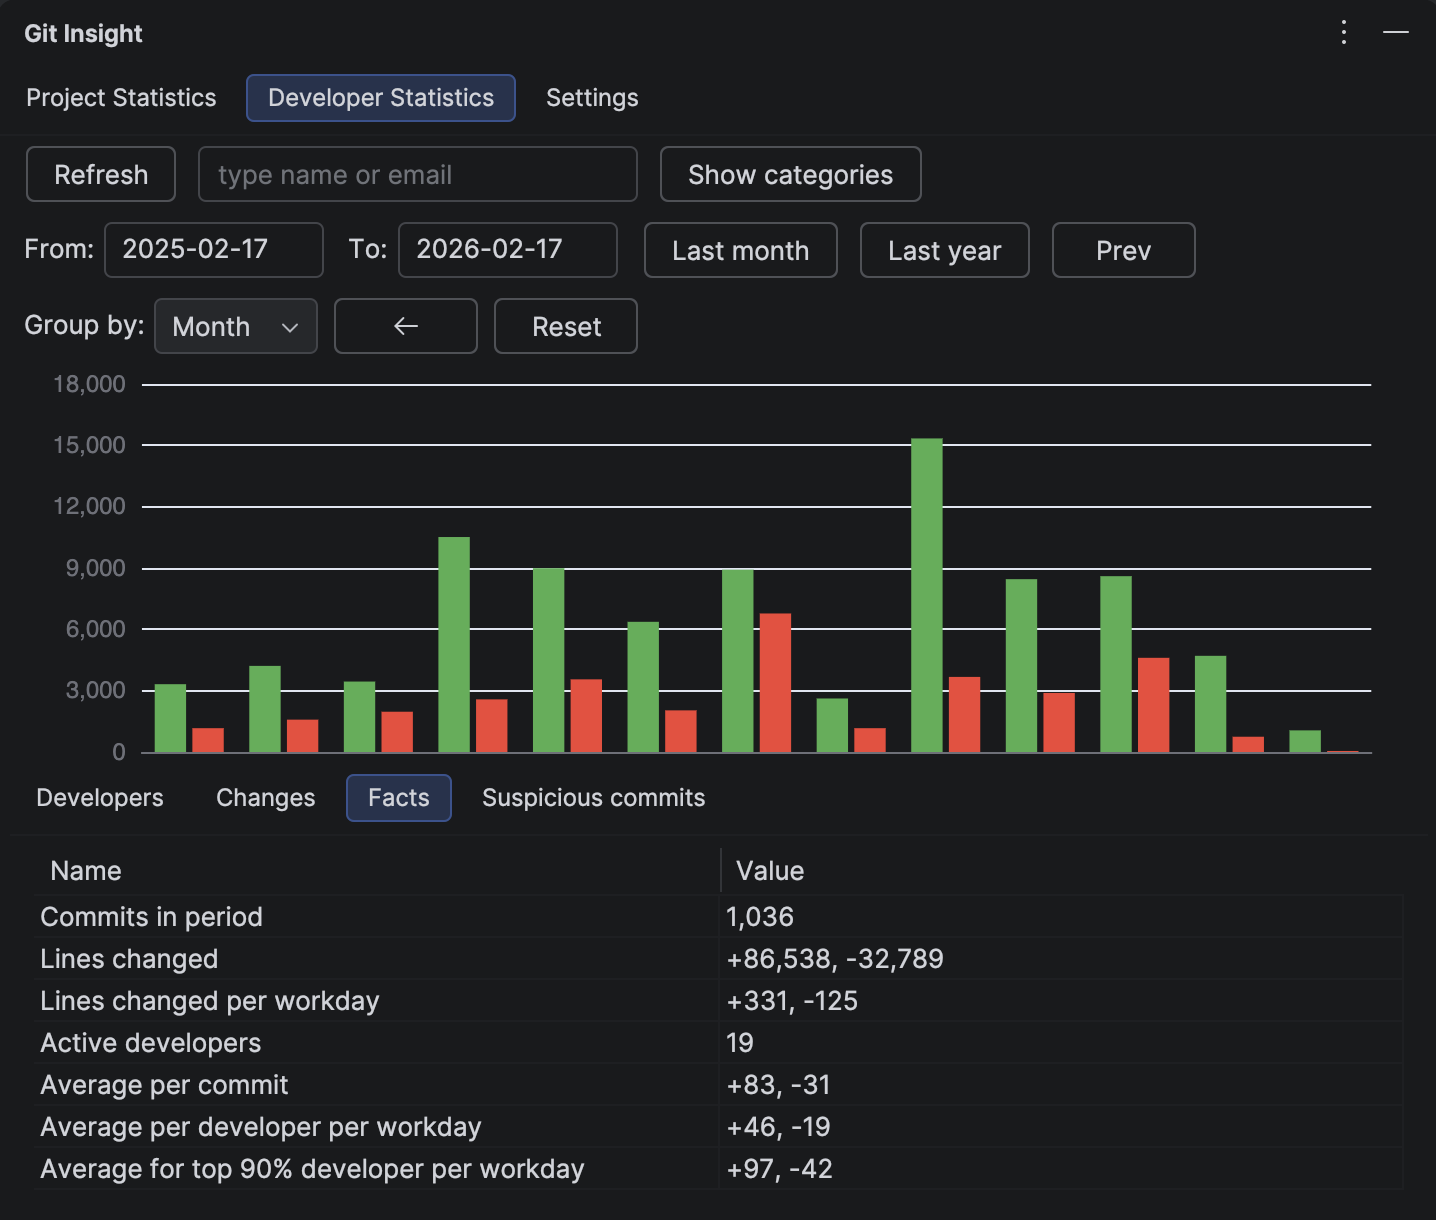
3 Review Velocity Metrics
The Facts tab provides calculated metrics:
- Lines changed per workday — project velocity (adjusted for weekends and vacation)
- Average per developer per workday — individual velocity
- Average for top 90% developer per workday — excludes one-off contributors (DevOps fixing a Dockerfile, a colleague from another team with a small PR)
These numbers provide a baseline for comparison, but remember: velocity is one signal among many, not a performance score.
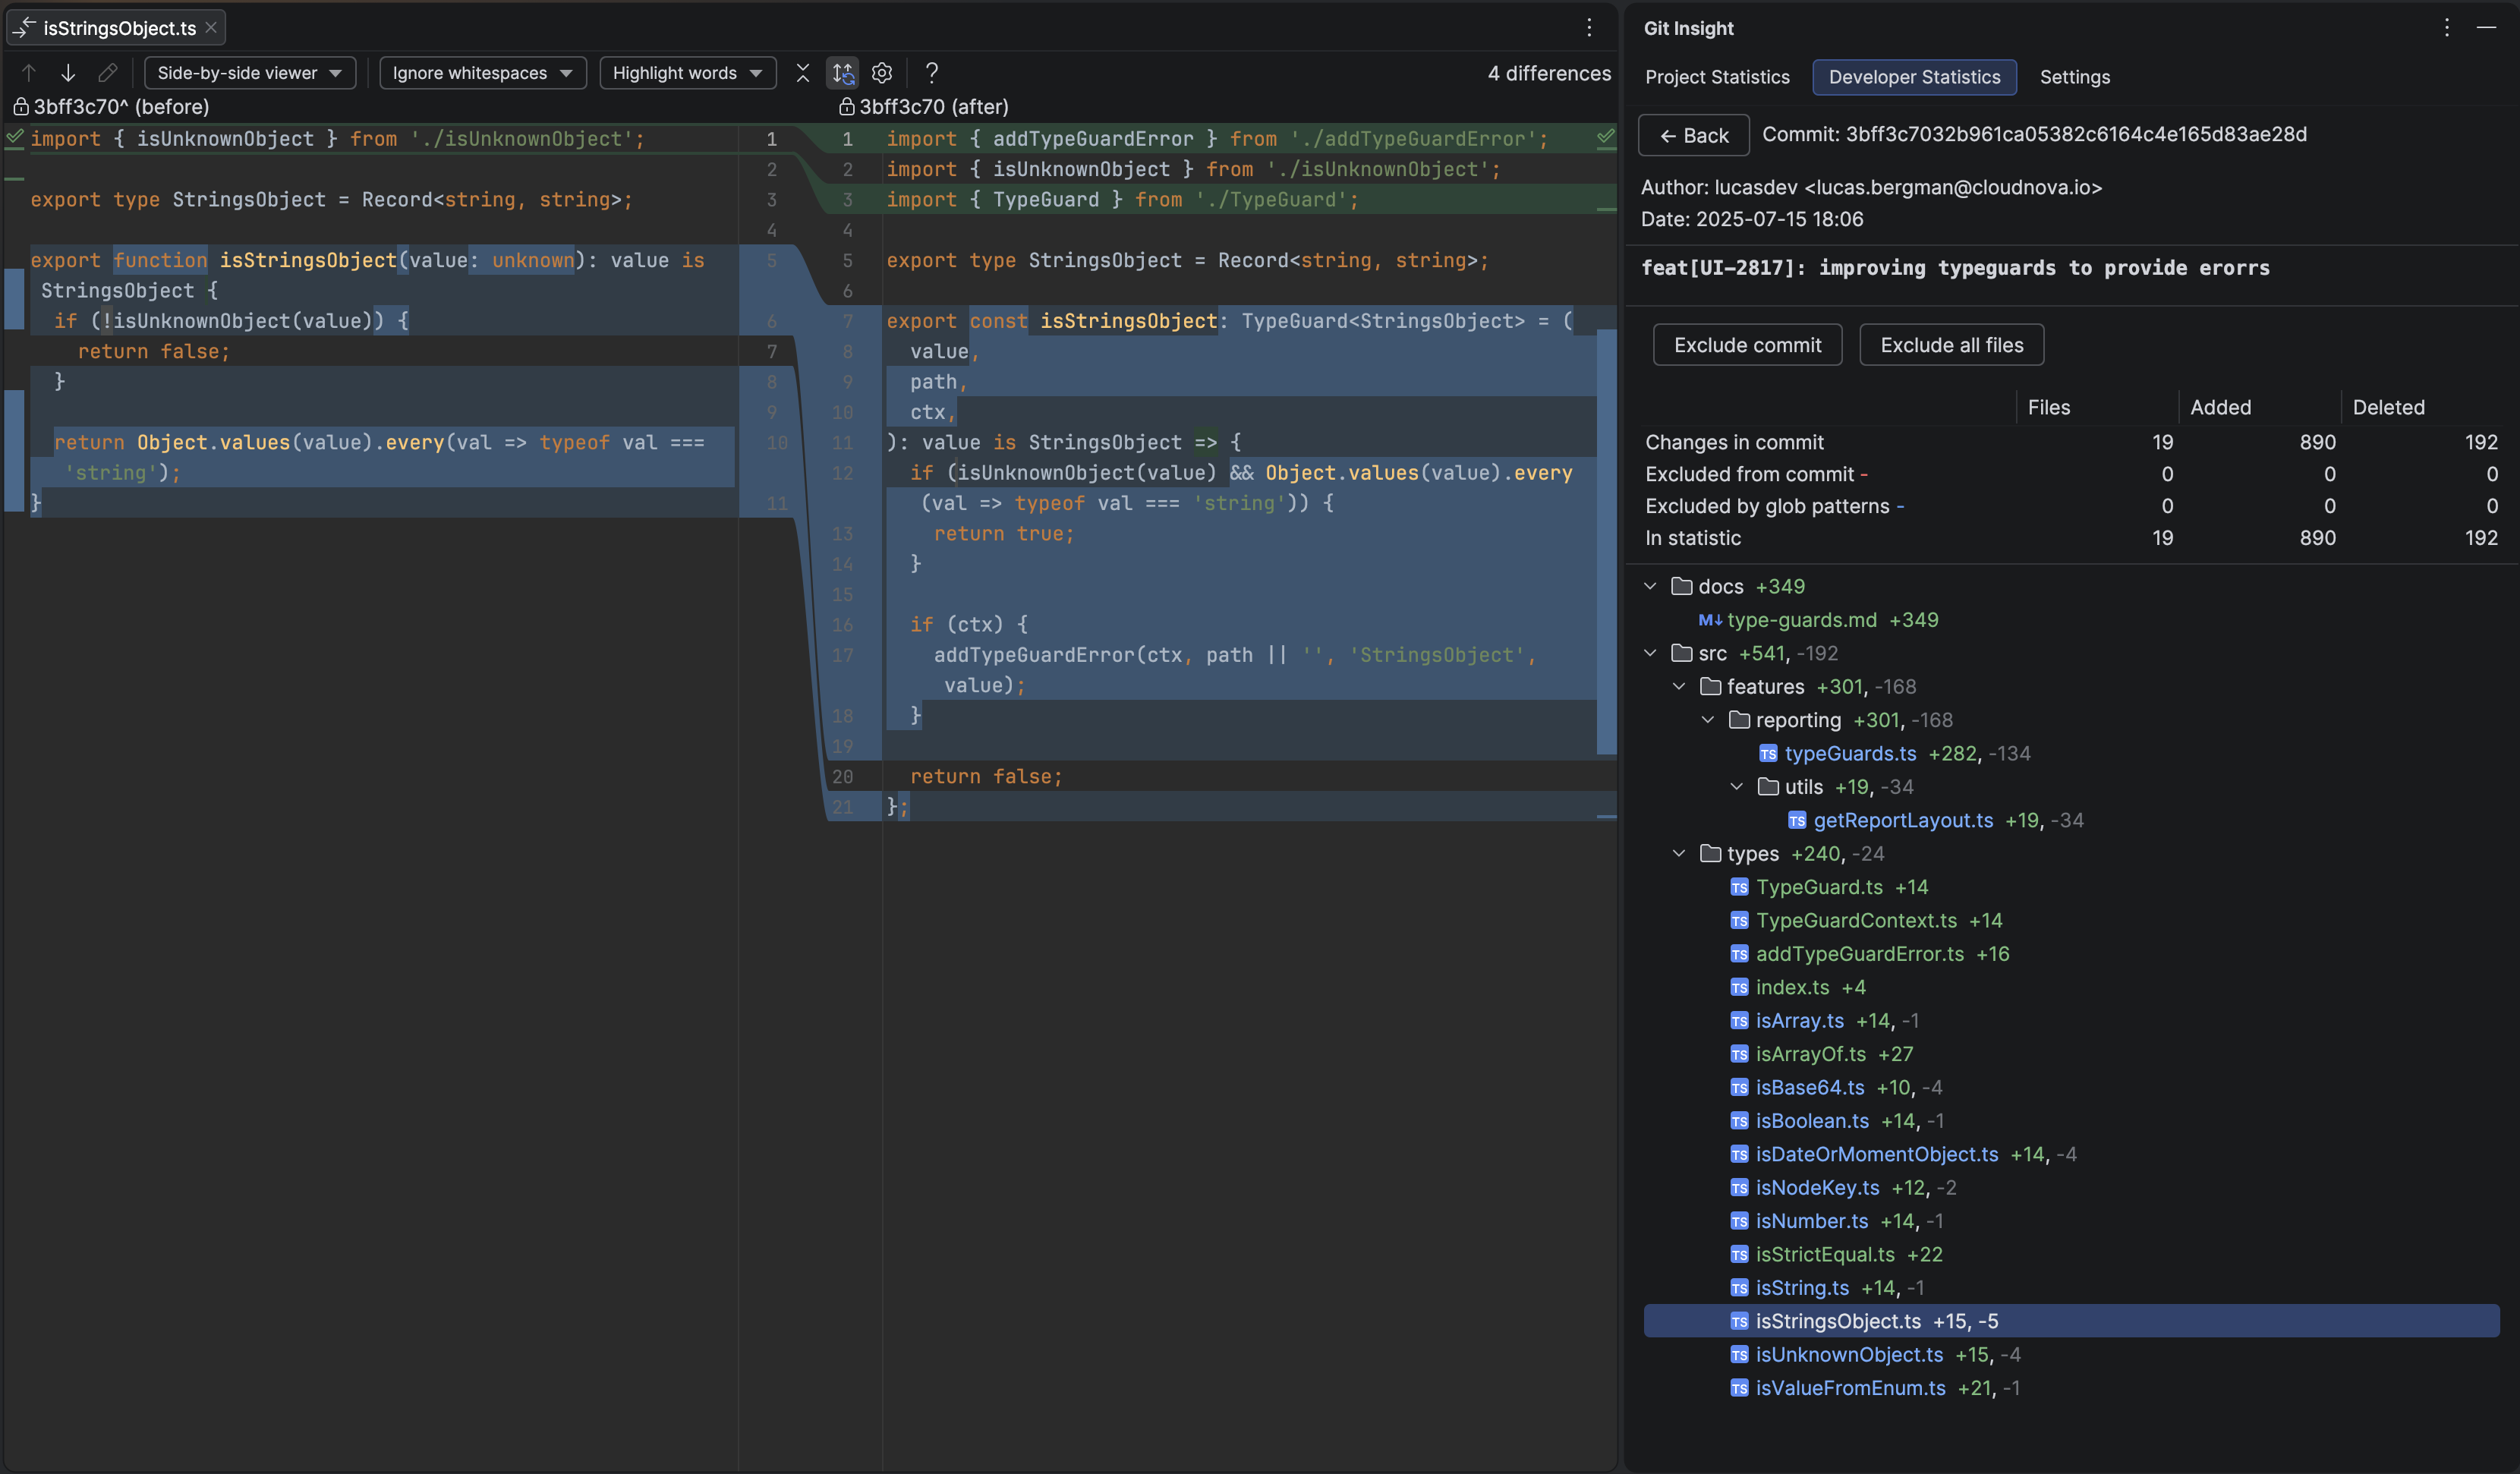
4 Deep Dive Where Needed
For any data point that catches your eye, you can drill down immediately. Double-click a commit to see its full details. Double-click a file to open it in the editor. View diffs inline or side-by-side. This is the key advantage of an IDE-integrated tool — you go from numbers to code context in one click.
5 Compare with Previous Periods
To put the numbers in context, use the Prev/Next buttons to shift to the previous period of the same duration. For example, if you're reviewing the last 6 months, one click on Prev shows the 6 months before that.
This lets you quickly compare:
- Velocity trends — is the developer speeding up, slowing down, or staying consistent?
- Shift in focus areas — did they move from frontend to infrastructure work?
- Growth signals — expanding into new parts of the codebase suggests growing ownership and expertise
Period-over-period comparison turns a static snapshot into a narrative — you can see not just what a developer did, but how their contributions evolved.
Fair Review Practices
- Compare periods of 6+ months — shorter periods amplify noise from vacations, on-call rotations, and unmerged branches
- Merge all git identities first — missing identities means missing attribution (see preparation guide)
- Exclude automated changes — formatting commits, dependency updates, and generated code don't reflect human effort (see preparation guide)
- Look at code areas, not just volume — the Changes tab reveals complexity and scope that line counts hide
- Share settings with your team — commit .idea/gitInsight.xml to VCS so everyone uses the same exclusions and categories
Time Savings
A typical engineering manager spends 2-4 hours per quarter collecting git statistics manually for reviews. That's 8-16 hours per year of a manager's time (valued at ~€60/hour), totaling €480-960.
Git Insight costs €59/year per organization. That's an 8-16x return on investment — and the plugin pays for itself after a single review session.
Try It on Your Team's Project
Install the free trial, open your project, and see your team's contribution data in minutes.
Install Free Trial